Metal packaging – Data 2019
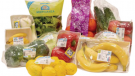
Sturdiness, barrier to external agents, perfect conservation of contents, recyclability: these are the strengths of metal packaging, containers with a long history and wide diffusion. Data on the performance of the national market, which in 2019 recorded a slowdown in production.
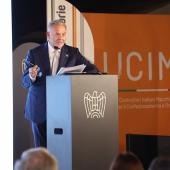
Barbara Iascone
Istituto Italiano Imballaggio
In 2019, the overall national production of metal packaging - steel (tinplate/thin sheet) and aluminium - was 779,100 tons, down by -3% compared to 2018.
In terms of weight, steel ones represent 85% of the total, while aluminium ones represent 15%. The proportion reverses if we analyse the turnover data; in this case, in fact, steel packaging represents 35%, while aluminium packaging 65%.
As for the recycling rates, in Italy metal packaging records among the highest values in the packaging sector, in second place after paper ones: over 77.5% for steel ones, 89.2% for aluminium ones released for consumption (sources: Ricrea and CIAL 2018, latest data available).
| 2016 | 2017 | 2018 | 2019 | var. 19/18 | |
|---|---|---|---|---|---|
| Turnover mln € | 4,365 | 4,506 | 4,547 | 4,456 | -2% |
| Production | 779.2 | 800.2 | 803.8 | 779.1 | -3.1% |
| Imports | 66.9 | 69.7 | 63.9 | 74.7 | 16.9% |
| Exports | 349.7 | 373.2 | 372.3 | 362.3 | -2.7% |
| Apparent Consumption | 496.4 | 496.7 | 495.4 | 491.5 | -0.8% |
Source: Data processing Packaging in figures on ISTAT variations for the 2020 hypothesis
Steel: types and market
Steel packaging is divided between light tinplate packaging and thin sheet metal drums. The former, in turn, are divided into three types:
- open tops are mainly used for packaging food preserves (peeled tomatoes, vegetables, ready-made sauces, legumes, fish products etc.). The use in pet-food is also widespread, although in decline in recent years in favor of aluminum boxes;
- the general line, or aerosol cans and cans for chemicals (paints and varnishes, solvents, etc.) or particular food products, such as oils;
- the closures, represented by crown caps and twist off caps.
The drums, on the other hand, are made with a steel sheet without a tin coating, but protected by an adequate internal and external painting.
With capacities between 50 and 300 liters, with a clear prevalence of the 200 l formats, they can be cylindrical or truncated-conical.
About 70% of them are used in the chemical and oil sector, for the packaging of oils, fuels or petrol. The remaining 30% are used to move seeds and tomatoes, or to transport other products intended for industry.
| Steel | Aluminum | |
|---|---|---|
| Turnover | 35% | 65% |
| Production | 87% | 13% |
Source: Imballaggio in cifre ed. 2020
The national market: characteristics and trends
The Italian production of steel packaging in 2019 recorded a negative trend (-2.6%) as regards the values expressed in weight, reaching 661,300 tons, compared to the approximately 679,100 produced in 2018. Based on the first calculations, the turnover - estimated at around 1,540 million euros - also fell (-1%).
Compared to 2018, the drop in production is also reflected in exports (-3.1%), especially in light packaging (-4%). The growth in exports related to drums (+ 4%), quantitatively lower than light ones, was not sufficient to boost total exports.
After a sharp decline in 2017, imports recorded a rise of + 1.4% in 2019, which adds up to + 1.3% in 2018.
The drop in production also affects the apparent consumption trend (-1.8%), calculated on the basis of the following mathematical formula: production + import - export (the data relating to the movement of stocks are not collected by the Institute).
In 2019, the overall production of light tinplate packaging was 550,000 t. Compared to 2018, there was a drop of 2.7% which, as we said, weighed negatively on the performance of the sector.
The data vary according to the type of packaging and the areas of application: open top - the most significant category in terms of quantity, which in 2019 represent 61.9% of the total tinplate packaging - are slightly down compared to 2018.
General line packaging, considering only chemicals and fancy boxes (excluding, therefore, edible oils and cans) stood at 18.8% (up on the previous year); closures at 10.9%. Tinplate packaging also includes cans for edible oil (4% in 2019) and aerosol cans (estimated at 4.4%).
As for steel drums, the 2019 production was 111,000 t (-2% compared to 2018). Imports grew by 4% while imports registered a decrease of -7%. Apparent consumption also fell by 4.6%.
| 2017 | 2018 | |
|---|---|---|
| Open top | 60.2% | 59.4% |
| Food oil | 3.9% | 3.9% |
| General line (chemical products and fancy tins) | 22.6% | 23.3% |
| Spraycans | 4.8% | 5.0% |
| Closures* | 8.5% | 8.4% |
| Total | 100.0% | 100.0% |
Source: Banca dati Istituto Italiano Imballaggio
Aluminium: types and market
The aluminum packaging category includes different types of packaging:
- containers of various sizes (cans, boxes and trays) for food and non-food products;
- tubes, also used for packaging food products (tomato paste, sauces, etc.) and non-food products (paints, cosmetics, etc.);
- aerosol cans and bottles, mainly used in cosmetics.
Among the types of packaging, we also find thin sheets and closures (screw capsules, easy open, etc ...).
The aluminum used for the production of the packaging includes the can stock for the production of beverage cans, the foil stock used both in the manufacture of thin sheets and in that of the capsules, the can body for box bodies for food, and the tablets used to produce cans.
The alloys that make up the various products are innumerable and vary according to the type of production and use.
| 2018 | |
|---|---|
| Beverages | 63.1% |
| Food | 19.4% |
| Pharma-Cosmetics | 16.7% |
| Other | 0.8% |
| Total | 100.0% |
Source: Banca dati Istituto Italiano Imballaggio
The national market: characteristics and trends
According to the data highlighted by “Packing in figures”, in 2019 the sector’s turnover reached 2.9 billion euros (- around 2% compared to 2018). The production expressed in weight was around 117,800 tons, also down (-5%).
Foreign trade shows diversified trends, given that imports grow by 57%, while exports drop by 0.6%.
The balance of trade balance is being influenced by the decisions of multinational companies which, having plants located in different countries, are inclined to reprogram their production according to the most favorable market policies, transferring the activities from one country to another; for this reason, the classifications of “import” and “export” may also vary, although the products are made by the same company.
The significant growth in imports is confirmed by consumption figures, against a 4.4% increase in demand.
Analysing in detail the trend of the different types of packaging, it emerges that 28% of the national production is represented by food containers (cans for drinks and cans), whose production in 2019, however, drops by 10%.
The category of thin sheets for wrapping or other intended use (e.g. jar closures), represents 10% of production, recording a negative trend of -10% compared to the previous year.
Closures also decreased (-4.2%), as did food trays (-5.7%).
Expressed by weight, the production of aluminium packaging in the last decade has recorded an average annual growth rate of 2.2%. Considering the reduction in the average weight of various types of packaging, the development rate is quantifiable around the average 3% per year.
Still considering the tons produced, these are the percentages attributed to the individual types: 28% refers to containers (beverage cans, food cans, spray cans and flexible tubes), 20% to closures, 18% to food trays, 10% to thin wrapping sheets, 28% to others.
In 2019, 63.6% of aluminium containers were used in the beverage sector, 18.9% in the food (including pet-food), 16.7% in the cosmetics and pharmaceuticals sector, the remaining 0.8% for other.
Recycling activities related to steel and aluminum packaging
- Based on the RICREA, data, the consortium that deals with the recycling of steel packaging at national level, 77.5% of the steel packaging released for consumption was recycled in 2018, for a quantity equal to 386,895 tons. The breakdown by type of packaging sees the greatest flow in the open top area with a share of 30%, drums and tanks represent 24%, general line packaging 16%, followed by closures with 8%. The remaining 17% is divided between straps and wire with 9% and the other packaging with 8%.
- According to the findings of CIAL (the consortium that deals with the recycling of aluminium packaging), in 2018 80.2% of the packaging released for consumption was sent for recycling, for a quantity equal to 54,300 t, on the increase compared the previous year; as a result of the recovery and regeneration activities, greenhouse emissions of 403 thousand tons of CO2 were avoided and energy equivalent to over 173 thousand tons of oil was saved.
Thanks to the properties of this material - 100% and infinitely recyclable, with an energy saving of 95% compared to traditional processes - 75% of all aluminium produced on a global level is still in use today. Europe is the continent where the amount of recycling per capita is the highest in the world, and Italy is among the most virtuous countries, being able to claim a 100% national production from post-consumer raw materials.