Nutraceutical and pharmaceutical products
Market trends, type of consumption, distribution and forms of packaging in light of the specific trends of the two areas in recent years.
Barbara Iascone
Istituto Italiano Imballaggio
In this review, we examine two different categories of products - nutraceuticals and pharmaceuticals - which, by analogy, we concentrate into a single and large sector, of which we provide evolutionary data with reference to 2019 and the first hypotheses developed for 2020.
Nutraceutical products
Nutraceutical in brief. The term nutraceutical, coined by Stephen De Felice in 1989, derives from “nutrition” and “pharmaceutical” and therefore refers to the study of nutrient principles, which have beneficial effects on health: Extracted and synthesized, they are used to produce food supplements, and are hence defined nutraceutical products. The category includes probiotics, antioxidants, polyunsaturated fatty acids (omega-3, omega-6), vitamins and enzymatic complexes.
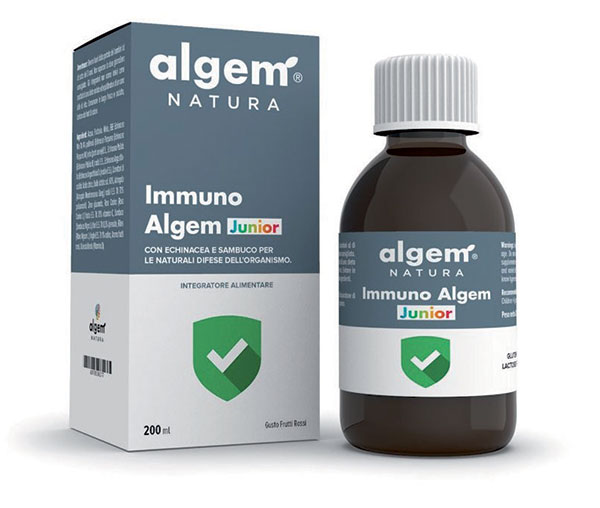
The nutraceutical products can be taken either as a “naturally nutraceutical food” or “enriched food” by a specific active ingredient (for example, milk supplemented with vitamin D or omega-3 acids). The formulations can be liquid, tablets or capsules..
Referring to the brief excursus on the meaning of “nutraceutics” shown in the box, we focus our attention on enriched foods and supplements.
From a first examination of the data relating to 2019, not yet complete at the time of writing, it emerges that the nutraceutical segment records consumption growing by about 3%: a trend that stands out remarkably in the general context of stability recorded the same year.
This trend shows that the consumption of supplements is now a habit rooted in the lifestyle of Italians, supported above all by the advice of doctors. In this regard, it is significant that in 2018 (latest data available in this regard) the medical prescriptions of food supplements were 26 million, compared to 20.3 million in 2016.
To date, there are about 32 million Italians who consume nutraceutical products, of which about 18 million use them habitually.
In 2019, the packs purchased in Italy stood at around 256 million, + 3.7% compared to 2018.
| 2016 | 2017 | 2018 | 2019 | |
| 231,6 | 241,1 | 246,4 | 255,5 |
Source: Quintiles Multichannel View Nutraceutica - Canali farmacia, parafarmacia, GDO / Pharmaceutical & Parapharmaceutical channels, largescale retail
Market volumes and distribution channels
The growing attention of Italians to health and proper nutrition in recent years has led to an exponential growth in the consumption of nutraceutical products, so our country is among the first in Europe.
In Italy, based on the latest available analyses prepared by Ims Health Italia, nutraceuticals worth more than 3.3 billion euros were sold in 2018, of which more than 86% through pharmacies, followed by parapharmacies and large-scale distribution .
Based on the analysis of the data relating to 2019 of the 255 million packs, about 70% is distributed through the online sales channel, of which a part via the internet sites of pharmacies and parapharmacies and not in stores. A percentage of purchases come from other channels that are not regularly monitored (portals, specific web services, etc.).
Consumption, especially in Italy, had such a positive evolution that it was an important compensation factor for the world of pharmacies which, on the contrary, experienced some suffering due to the contraction in prices.
Among the factors that support the positive trend of the consumption of nutraceutical products, doubled in the last eight years, there is their continuous innovation process. In fact, every year the turnover of the sector grows with the introduction of new products, which subtract market shares from “historical” references.
In this sense, promotion and advertising communication play a fundamental role and the more effective they are, the more the consumption of a product is consolidated.
Although growth has slowed in the last two years, the performance of the nutraceutical segment remains positive, continuing to support the consumption of the pharmaceutical sector. Moreover, more and more often, doctors prefer - where possible - to prescribe this type of product, compared to actual pharmaceutical products.
| Million pieces | % | |
| Digestive/intestinal system | 69.5 | 27.2 |
| Vitamins/minerals/food supplements | 54.4 | 21.3 |
| Cough/cold respiratory system | 23 | 9 |
| Circulatory system | 15.6 | 6.1 |
| Tonics | 14.3 | 5.6 |
| Circulatory system | 11.2 | 4.4 |
| Tranquilizers | 11 | 4.3 |
| Analgesics | 7.9 | 3.1 |
| Products for losing wieght | 7.7 | 3 |
| Others | 40.9 | 16 |
| TOTAL | 255.5 | 100 |
Source: Quintiles Multichannel View Nutraceutica - Canali farmacia, parafarmacia, GDO / Pharmaceutical & Parapharmaceutical channels, largescale retail
Product categories and packaging
The nutraceutical sector is also of some importance with regard to the volume of packaging used, although they represent only a small part of the national packaging sector.
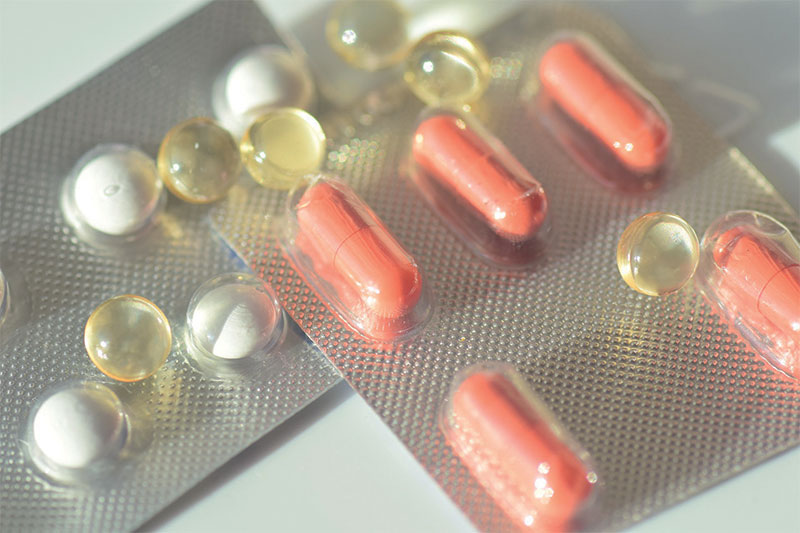
Based on the assessments prepared by the Italian packaging institute, the more than 255 million packs referable to the year 2019 are mainly divided between plastic/aluminium blisters used for capsules and tablets, and plastic bottles and jars. The former represent 43.9% of the packaging in the sector, while the latter record a share of 33.9%.
These types of packaging are present in all sectors of nutraceuticals, from products to support the digestive system to cardiovascular, going by way of food supplements.
Following are the bottles and glass jars (16.5% of the packaging mix). Glass is used to package both liquids and capsules. Particularly present in the sector of tonics and stimulants, prescribed most of the time to treat stress and tiredness, but also in the field of products supporting the circulatory system.

The remaining 5.7% is divided between laminated sachets (CA + ALL + PE) accounting for 4.9%, and aluminium tubes, accounting for 0.8%. The former are used for granular and soluble products, the others for ointments and creams.
The percentages indicated above refer to the primary packaging, i.e. in direct contact with the product, to which cardboard boxes (secondary packaging) as well as closures and labels (accessories) must be added.
Again according to the data processed by the Institute’s database, this market area generates over 12,000 tons of packaging (including closures, accessories and cardboard boxes).
| % | |
| Plastic flacons and jars | 33.90% |
| Laminate pouches (CA+ALL+PE) | 4.90% |
| Stiff aluminium tubes | 0.80% |
| Blister (ALL/PVC et ALL/ALL) | 43.90% |
| Glass bottles and flasks | 16.50% |
| Total | 100% |
Source: Istituto Italiano Imballaggio elaborations on Quintiles Multichannel View Nutraceutica data.
Pharmaceutical products
The analysis of the pharmaceutical area remains a fairly linear activity over time, given that the type of products that belong to it, by their nature and function, do not show evident changes from one year to the next.
Another fundamental characteristic of the sector is the typicality of the product, which leads to the subdivision of the product into many sub-sectors represented by products irreplaceable with each other (an anti-inflammatory product cannot be replaced by an antibiotic).
Another element to highlight concerns the sales channel, which for some years now has no longer been the preserve of pharmacies and hospitals. Thanks to various regulatory interventions by the State (Legislative Decree 31 March 1998 and art.5 of L 248/06), large-scale retailers, parapharmacies and herbalists can in fact sell the so-called “over the counter products”, which do not require any medical prescription. .
Finally, the peculiarity of the sector manifests itself in the types of packaging used: each product, in fact, needs a specific pack that can hardly be replaced.
| 2009 | 2010 | 2011 | 2012 | 2013 | 2014 | |
| 1980 | 2030 | 2050 | 2061 | 2071 | 2081 |
| 2015 | 2016 | 2017 | 2018 | 2019 | 19/18 | var % m.a. | |
| 2052 | 2003 | 1965 | 1951 | 1934 | -0.90% | -0.20% |
Source: Banca Dati Istituto Italiano Imballaggio
Performance of the sector
Based on Prometeia’s elaborations, the pharmaceutical sector as a whole (OTC and over-the-counter products, including hospital and veterinary drugs), in terms of turnover at current prices, expressed a growth of about 2.2% in 2019. According to ISTAT, production also recorded a similar positive trend in the same year (+ 2.2%).
Federfarma’s analyses in 2019 revealed a slight drop in affiliated pharmaceutical spending (-0.2%, excluding veterinary drugs), corresponding to a drop in the average value of recipes.
Even the packages supplied by the National Health System recorded a drop of 0.9% compared to the same period of the previous year.
Different forecasts for 2020, for which Prometeia has predicted that the pharmaceutical sector will be the only sector to record a positive growth rate, closing the year with a + 4.2%, on which the unexpected effects are presumably affected of the pandemic.
Quantity and consumption of packaging in 2019
The packs marketed can be divided as follows:
About 85.5% are ascribed to class A, B and C ethical products (with reference to the distribution of the Ministry of Health), about 2% to other ethical products sold without a prescription and 12.5% to OTC pharmaceutical products, tending to rise.
The analysis of the packaging mix reported in this report refers to the area of ethical and OTC drugs sold in pharmacies, with a prescription, therefore excluding hospital drugs and veterinary drugs.
Based on numbers from the Italian Packaging Institute database, considering only primary packaging, 1,934 million packs were used in 2019; cardboard boxes, the descriptive leaflet and any accessories for dispensing the medicine are therefore excluded from this estimate.
In terms of weight, the packs produced in Italy reached around 50,100 t, to which, however, cardboard boxes for secondary packaging must be added, thus reaching a total of about 110,000 t (-0.1% compared to 2018).

Types of pharmaceutical products and packaging forms
Depending on the type, we can divide the sector into liquid products, solid products and cream/gel/foam products.
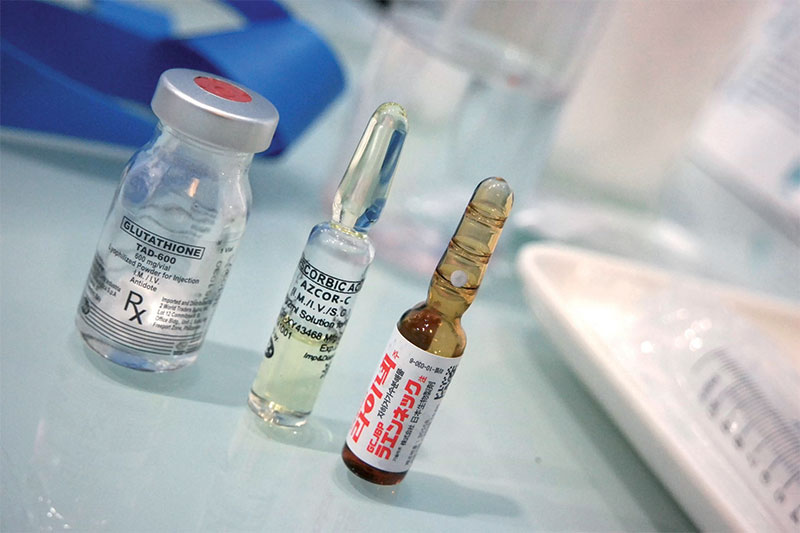
- Liquid products. The area is divided into oral, injectable and non-drinkable liquid pharmaceutical products (mainly ophthalmic). For the former category, the packaging mix is divided between glass packaging (62%), plastic bottles (35%) and sachets of coupled material (3%); the latter are packaged exclusively in glass; the third category uses 93% plastic vials, 5% coupled sachets and the remaining 2% glass vials.
- Solid products. In general for oral use, granules, tablets, pills etc. 92% of them are packed in ALL/PVC or ALL/ALL blisters; the remaining part is divided between polylaminate sachets (4.5%), plastic bottles (2%), rigid aluminum tubes (1%), and glass vials (0.5%).
- Cream/ointment/gel/foam products. For transdermal products, aluminium tubes (66%), plastic tubes (24%), coupled material sachets (10%) are used.
- Secondary packaging, for transport and closures. In addition to primary packaging, pharmaceutical packaging also includes secondary packaging (cardboard boxes) and transport packaging (corrugated cardboard cases, pallets, stretch film, etc.).
All ethical and OTC drugs sold in pharmacies include the use of cardboard boxes, which contain the medicinal product, the “leaflet” and any accessories for dispensing.
It is estimated that in 2019 the total weight of the cardboard boxes only is around 38,500 tons.
The closures of primary packaging are divided between aluminium (59%) and plastic (41%) for a total of approximately 1,600 tons.
| Products liquid oral use | |
| Glass bottles | 62 |
| Plastic bottles | 35 |
| Laminated pouches | 3 |
| Injectable liquid products | |
| Plastic bottles | 93 |
| Laminated pouches | 5 |
| Glass vials | 2 |
| Solid oral products | |
| Blisters in ALL/PVC ALL/ALL | 92 |
| Laminated pouches | 4.5 |
| Plastic bottles | 2 |
| Aluminium tubes | 1 |
| Glass vials | 0.5 |
| Cream/gel/foam products | |
| Aluminium tubes | 66 |
| Plastic tubes | 24 |
| Laminated pouches | 10 |
Source: Banca Dati Istituto Italiano Imballaggio
The mix of packaging by material
We report the information on the mix of packaging materials, based on the surveys for 2019 of the Italian Packaging Institute, with reference to the main primary packaging formats. It should be noted that by its nature the pharmaceutical sector does not show large differences in the mix of packaging relating to packaged products, therefore only small changes over the course of time have occurred due to the performance of individual products.
- Aluminium: Confirmed as the sector’s leading material with 60% share, the blister packs of which represent 55.4% of the total packaged. The remaining part is represented by flexible and rigid tubes (which together reach 3.6% of the total), followed by spray cans (1%).
- Glass. Glass packaging accounts for 21% of the total and the vials are intended for injectable or drinkable products: the former represent 10.1% of the total packaging while the latter represent 4.6%. Another type of glass packaging are bottles for syrups (about 6% of the entire packaging sector for pharmaceutical products). The glass vials for ophthalmic products constitute around 0.4%, that though are being undermined by plastic, now pre-eminent for this type.
- Plastic. Pharmaceutical products packed in flacons, flexible tubes etc. plastic in recent years have shown a slow but progressive growth trend, reaching a share of 18.8% in 2019.
- Paper. Spiral cardboard containers for granular pharmaceutical products represent 0.2% of the market.
63.5% of the aforementioned medicinal products (ethical and OTC drugs sold in pharmacies), are in solid form (including granules, tablets), 31% in liquid form and 5.5% in other forms.
By analysing the segmentation based on the type of drug, we can identify three product categories: liquid, solid and cream/gel/foam.
| 2013 | 2014 | 2015 | 2016 | 2017 | 2018 | 2019 | |
| Aluminium packaging | 59.6 | 60.8 | 60.8 | 60.7 | 60.7 | 60.5 | 60 |
| Blister products | 55.1 | 56 | 55.8 | 55.8 | 55.9 | 55.8 | 55.4 |
| Flexible and rigid tubes | 3.2 | 3.8 | 3.9 | 3.9 | 3.8 | 3.7 | 3.6 |
| Metal spray cans | 1.3 | 1 | 1.1 | 1 | 1 | 1 | 1 |
| Glass packaging (vials, flacons, bottles) | 20.9 | 20.2 | 20.2 | 20.2 | 20.2 | 20.5 | 21 |
| Plastic packaging | 19.1 | 18.6 | 18.8 | 18.9 | 18.9 | 18.8 | 18.8 |
| Flacons, flexible tubes, etc. | 12.4 | 12.1 | 12 | 12 | 12 | 12 | 12.1 |
| Bubble packs, strips, polylaminate bags, monodose | 6.7 | 6.5 | 6.8 | 6.9 | 6.9 | 6.8 | 6.7 |
| Spiral-wound carton | 0.4 | 0.4 | 0.2 | 0.2 | 0.2 | 0.2 | 0.2 |
| Total | 100 | 100 | 100 | 100 | 100 | 100 | 100 |
Source: Banca dati Istituto Italiano Imballaggio