Coffee & tea: the market in Italy
We here list the market values as well as the product and packaging characteristics registered between 2018 and 2019 for the two types of coffee and tea based beverages.
Barbara Iascone
Istituto Italiano Imballaggio
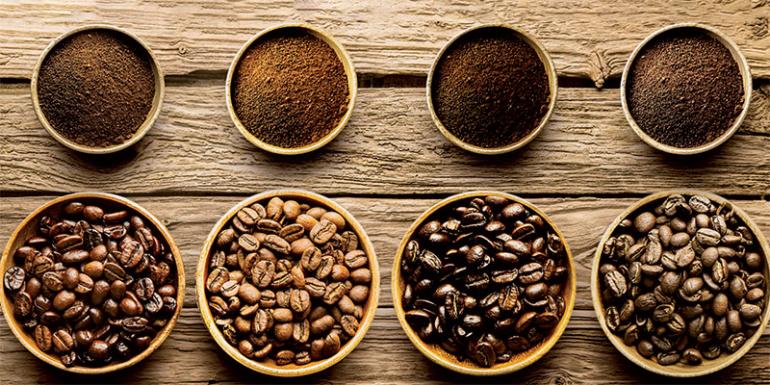
Coffee: market and consumption
The coffee sector is among the most important markets in Italy. The “production” figures refer exclusively to the roasting of imported green coffee (roasting and grinding of the beans) in that in Italy there are practically no plantations.
There are about 800 companies active in this sector, which can boast great expertise in mixing grains from different geographical areas to great effect.
At the moment, the only surveys available are those done by ISTAT, which report a drop in the production of roasted coffee in 2018 in Italy: precisely -20% in value compared to the 415,000 t produced.
According to initial ISTAT estimates, in 2019 production is estimated to have grown by about 3%, reaching 427,000 t.
As regards foreign trade, in 2018 over 606,000 tons of green coffee was imported, equal to approximately 1.27 billion euros. If we also consider the lesser imports (roasted coffee, soluble coffee and coffee-based preparations) the tons reach 623,000.
Table 1. Balance of coffee market in Italy.
| 2017 | 2018 | 2019 | ||||
| mln € | t/000 | mln € | t/000 | mln € | t/000 | |
|---|---|---|---|---|---|---|
| Production of roasted coffee | 5,210 | 672 | 3,785 | 415 | 3,899 | 427 |
| Total imports | 1,588 | 585 | 1,478 | 623 | 1,478 | 623 |
| Imports green coffee | 1,382 | 570 | 1,271 | 606 | 1,215 | 612 |
| Imports roasted coffee | 206 | 15 | 207 | 17 | 243 | 25 |
| Total exports | 1,440 | 219 | 1,431 | 232 | 1,431 | 232 |
| Exports green coffee | 40 | 10 | 38 | 11 | 40 | 13 |
| Exports roasted coffee | 1,400 | 209 | 1,393 | 221 | 1,497 | 265 |
| Apparent consumption | - | 351 | - | 374 | - | 380 |
| Consumption of roasted and ground coffee | - | 280.80 | - | 299.20 | - | 304.05 |
| Non industrial consumption | 235.87 | 251.33 | 255.40 | |||
| Domestic consumption | 153.32 | 163.36 | 166.01 | |||
| Horeca consumption | 82.56 | 87.96 | 89.39 | |||
Source: III databank processing of Istat data.
Over half of Italy’s imports come from Brazil and Vietnam, followed by India, Uganda, Indonesia and Colombia.
The first assessments for 2019 show a 1% growth in volume of green coffee imports while, in parallel, a drop of about 4% in value is seen.
In 2018, 38% of the Italian roasted coffee production was exported: 221,000 t for a value of approximately 1.4 billion euros.
Over the past 10 years, exports of roasted coffee have more than doubled, confirming the growing demand for the Italian espresso on foreign markets: This being about 60% from European countries, followed by the United States, Australia and Russia. For 2019 exports of roasted coffee are expected to register + 20% in volume and + 7.5% in value.
Apparent consumption (green coffee imports - total exports excluding inventory movements) grew by 7% in 2018, and a further 1.6% in 2019.
When it comes to coffee consumption however, some factors must be considered, if we analyse the data by weight: first of all, the fact that roasted and ground coffee weighs 20% less than green coffee beans, therefore going from 374 to 299 t/000. Of this, 84% is intended for the preparation of the beverage, whether it is consumed at home or away from home, while the remaining 16% is intended for industrial use, i.e. the preparation of ice cream, yogurt, soft drinks, desserts, etc.. Calculations to hand, the tons of packaged coffee consumed in Italy in 2018 were 251,330, a value that in 2019 should grow by 1.6%.
As for the portion not intended for industrial use, therefore consumed as a beverage, approximately 65% is destined for domestic consumption (including pods at offices), while the remaining 35% is covered by Horeca + Vending consumption (non pod based vending machines).
A further subdivision regarding coffee consumption is that which takes into consideration the different types: of coffee destined for domestic consumption, 90% is accounted for by ground coffee, 6.7% by beans and 3.3% by soluble coffee.
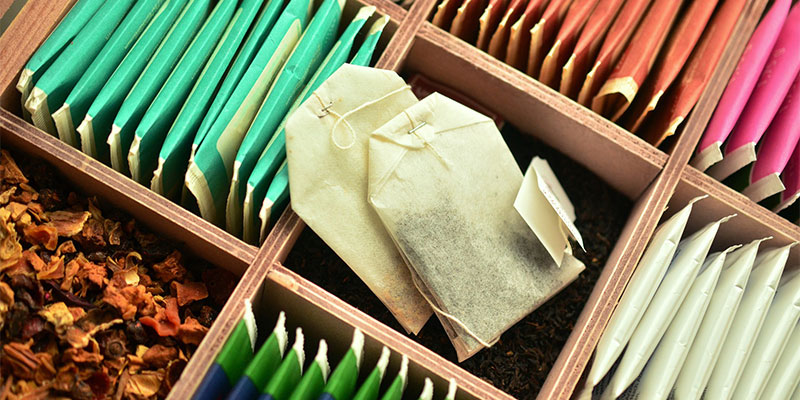
Tea: market and consumption
Also in the case of tea, “production” mainly refers to the product imported in bulk and packaged in Italy.
In Italy there are only four small tea plantations and industrial production (sachets or tins) is mainly based on imports. As regards infusion teas, in 2018 (latest data available) in Italy about 157 million packs of tea and infusions (including camomile, mallow, etc.) were purchased for a total value of 303 million euros: the quantities consumed grew by 4.7% compared to 2017, with a change in value of + 5%. In this context, tea confirms its primacy, albeit with stable consumption compared to the previous year: The absolute protagonists of the positive trend are infusions, whose volume growth rate in 2018 is over 15%.
In Italy, however, tea consumption does not only concern infusion; in fact, a very important market share refers to the consumption of packaged cold drinks, often purchased in place of other flat and carbonated drinks or fruit juices.
Iced tea is the flat drink most drunk by Italians, with a per capita consumption of over nine litres/year, among the highest values in Europe: Italy has seen a boom in cold tea and which is the most consumed drink in the country after coca cola
In addition to the traditional fruity flavors, green tea (which has now reached about 10% of the total volumes) and decaffeinated cold tea (the latter mainly aimed at children) have become established.
According to the data processing of the Italian Packaging Institute in 2019, the consumption of cold tea settled at around 575 million litres with a growth of 5.3% compared to 2018. According sector analyses, there are no imports of this drink, while exports continue to grow, which in 2019 grew by over 12%.
Table 2. Balance of the tea market (values expressed in millions of litres).
| 2017 | 2018 | 2019 | |
|---|---|---|---|
| Production | 746 | 787 | 843 |
| Import | - | - | |
| Export | 201 | 239 | 268 |
| Consumption | 545 | 548 | 575 |
Source: III databank processing of Istat data.
Quantity and types of packaging
How coffee is packaged
Around 25,000 tons of packaging are used in the coffee sector in one year: this figure includes both the portion intended for Horeca (bars and restaurants) and that consumed at home (including capsules used both at home and in the office). Translated in value this totals 147 million euros.
Let’s now take a look at the division of the packaged product, analysed per type of packaging.
84.5% of the product is packed in flexible polylaminate bags, with capacities varying from 250 gr to 3 kg (the latter destined for Horeca and in the last year slightly decreasing due to the ever greater diffusion of capsules).
7.5% is attributable to steel tins, which have the same capacities as polylaminate containers. This type of packaging has also seen a slight drop in favor of capsules (pods).
5% is represented by single-portion coffee packed in aluminium capsules or pods made of plastic or paper. The remaining 3%, which mainly refers to soluble coffee, is mainly packed in paper bags (2.4%), or in glass jars (0.5%); lastly come cardboard boxes (0.1%).
As regards single-portion coffee, aluminium capsules are the segment that has grown the most since 2016 (latest data available), registering + 11% against a decline in plastic capsules and paper pods.
In recent years there has been an increasing swing towards the use of capsules made of biodegradable material, to facilitate their disposal and recyclability.
Capsules made of any other material cannot in fact be separated from the product after consumption and therefore cannot be included in the collection cycle of the main material.
Lastly, if we open a window on the Horeca sector alone, the packaging mix is 85% flexible laminate packaging, 8% paper bag and 7% in steel tins. These are packs with a capacity of over 1 kg.
Table 3. Mix of coffe packaging for direct consumption. Figures % for quantity of product packed in the year 2019.
| 2019 | |
|---|---|
| Flexible polylaminates | 84.50% |
| Steel cans | 7.50% |
| Pods and capsules | 5.00% |
| Paper bag | 2.40% |
| Glass jar | 0.50% |
| Cardboard folding box | 0.10% |
Source: III databank processing of Istat data.
How tea is packaged
The packaging mix relating to tea and infusions must be distinguished, depending on whether we are talking about the product intended for infusion or whether the packaged beverage sector is analysed.
In the first case packaging is in single sachets or of bulk product. The individual sachets are collected in cardboard boxes, an average of 20 sachets of 2 gr to each box, while for the bulk product about 70% is packaged in cardboard boxes and 30% in steel tins. Speaking of the packaged beverage, the packaging mix is much more varied. In 2019 about 29,100 tons of packaging was used to pack cold tea for a value of about 174 million euros.
PET bottle packaging is the most common, with a share of 70.9% and with formats ranging from 50 cl to litre and a half. Below that we find the PS beaker, 20 cl format (16.8%), a type of packaging that, in recent years, has been losing market share in favor of the cheerpack. We then find the 33 cl aluminium tin (6.5%) and the brik (2.9%). To complete the scenario regarding the iced tea packaging mix we have the cheerpack (2.7%) with capacity equivalent to both the PS beaker and the brik, on which the cheerpack has been gradually gaining ground over the past five years.
The 50 cl glass bottle closes the list, positioned today at 0.2% but which, based on available analyses, is improving its position in the iced tea packaging mix, gaining a few percentage points, also thanks to the launch in the Horeca sector of Estathè in a glass bottle.
Table 4. Mix of tea packaging. Figures % for quantity of product packed in the year 2018.
| % | |
|---|---|
| PET bottles | 71.00% |
| PS beakers | 17.00% |
| ALU tins | 7.00% |
| Brick | 3.00% |
| Cheerpack | 2.40% |
| Glass bottles | 0.10% |
Source: III databank processing of Istat data and associations figures