Glass packaging
Types, quantities and uses of hollow glass and tube glass packaging. 2020 market data and facts.
Barbara Iascone
Istituto italiano Imballaggio
This analysis examines both hollow and tube glass packaging. As far as hollow glass packaging is concerned, the breakdown used in Imballaggio in Cifre and shared with the trade association Assovetro is divided into bottles, jars and flacons. Tube glass packaging is present in the pharmaceutical sector and can essentially be of two types, vials and bottles.
Markets of use
The field of use of glass packaging is wide: from the food sector, both food and beverage, to the cosmetics and pharmaceutical sectors.
A characteristic of this type of packaging is the strong roots in the areas where it is used (in particular wine, sparkling wines and spirits). Precisely because of this peculiarity, its evolution is closely linked to the trend of the user sectors, rather than to shifts in the packaging mix of the sector itself.
For several years now, glass packaging has achieved a certain stability, after having undergone fierce competition, especially from plastic. For example, as far as mineral water is concerned, the glass bottle was replaced 20 years ago by the plastic one, and it limits its presence to the Ho.Re.Ca. sector, where it remains the preferred packaging as it is synonymous with elegance. It should be noticed, however, that in this sector, the spread of systems for the mineralization of natural or carbonated water in restaurants is also giving the glass bottle a hard time.
There is no doubt that in 2020, an anomalous year as far as consumption is concerned, glass packaging, as well as other types of packaging, has suffered a harsh setback. The strong link with the catering sector - but also with the cosmetics sector - has negatively influenced the sector trend. For example, the Ho.Re.Ca. sector registered a drop in volumes of over 37% in 2020, with a significant impact on the consumption of glass bottles. On the other hand, the losses were offset by the good performance of largescale distribution, especially as regards the sale of packaged food preserves: domestic consumption, also and above all during the lockdown, favored the purchase of food products packaged in glass jars (vegetable and animal preserves, ready-made sauces, tomato derivatives, etc.).
| Anno | Produzione | Export | Import | Cons. Apparente |
|---|---|---|---|---|
| Year | Production | Exports | Imports | Apparent consumption |
| 2001 | 3.519 | 459 | 306 | 3.366 |
| 2002 | 3.540 | 433 | 356 | 3.463 |
| 2003 | 3.561 | 458 | 305 | 3.408 |
| 2004 | 3.602 | 476 | 378 | 3.504 |
| 2005 | 3.561 | 411 | 362 | 3.512 |
| 2006 | 3.568 | 419 | 367 | 3.516 |
| 2007 | 3.641 | 453 | 381 | 3.569 |
| 2008 | 3.695 | 450 | 433 | 3.678 |
| 2009 | 3.354 | 360 | 398 | 3.392 |
| 2010 | 3.528 | 405 | 544 | 3.667 |
| 2011 | 3.590 | 421 | 552 | 3.721 |
| 2012 | 3.414 | 412 | 571 | 3.573 |
| 2013 | 3.463 | 442 | 522 | 3.543 |
| 2014 | 3.719 | 440 | 614 | 3.893 |
| 2015 | 3.811 | 467 | 656 | 4.000 |
| 2016 | 3.937 | 445 | 704 | 4.196 |
| 2017 | 4.048 | 452 | 679 | 4.275 |
| 2018 | 4.167 | 482 | 793 | 4.478 |
| 2019 | 4.369 | 513 | 834 | 4.690 |
| 2020 | 4.326 | 465 | 910 | 4.771 |
Sector data
- According to what emerges from the analysis published in Imballaggio in Cifre (Istituto Italiano Imballaggio ed. 2021, Assovetro data processing), in 2020 the production of glass packaging expressed in tons will drop by 1% compared to 2019, settling at around 4,326 t/000.
- In 2020, foreign trade shows significant drops for exports (-9.5%) but marks a positive trend for imports (+9.1% compared to the previous year).
Therefore, foreign trade confirms the usual negative trade balance for Italy, which translates into a higher apparent consumption of glass containers compared to domestic production: this characteristic is common to bottles and jars, since Italian production capacity cannot meet the needs of the domestic market and it is therefore necessary to draw on imports.
As far as the trend of turnover in the sector is concerned, a drop of around 1% is hypothesized.
| Bottles (including returnables) | 2020 | 2019 |
|---|---|---|
| Alcoholic beverages | 62.70% | 60.60% |
| Non alcoholic beverages (1) | 27.30% | 29.90% |
| Condiments (2) | 5.10% | 5.00% |
| Tomato derivates (3) | 4.90% | 4.50% |
| Total | 100% | 100% |
| (1) Milk included (2) Food oil and vinegar (3) Tomato sauces and ketchup |
||
| Jars | 2020 | 2019 |
| Vegetable preserves and sauces | 63.00% | 62.20% |
| Yoghurt | 0.80% | 0.80% |
| Babyfoods | 9.00% | 9.10% |
| Fish preserves | 5.50% | 5.80% |
| Other | 21.70% | 22% |
| Total | 100% | 100% |
| Hollow glass flacons | 2020 | 2019 |
| Cosmetics and perfumes | 59.50% | 60.00% |
| Pharmaceutical products | 32.60% | 32.00% |
| Other (1) | 7.90% | 8.00% |
| Total | 100% | 100% |
| (1) Chemical | ||
| Flacons and vials in tubular glass | 2019 | 2019 |
| Cosmetics and perfumery | 85% | 85% |
| Pharmaceutical | 14% | 14% |
| Other (1) | 1% | 1% |
| Total | 100% | 100% |
| (1) Chemical | ||
Bottles
The production of bottles accounts for 88% of empty glass packaging and in 2020 will register a -2.3% decrease. The trend of bottle production is undoubtedly influenced by exports (-10.8% compared to the previous year, the domestic market is quite stable). Imports grew by 7.5%.
Also for bottles, as previously explained, the trend of the main sectors of use is decisive, which in 2020 registered widespread downturns. More than 62.7% of bottles used are for alcoholic beverages (-1%) and, considering the year we are analyzing, the drop is more than acceptable. The non-alcoholic beverages area, including milk, absorbs about 27.3% of glass bottles. This area, in 2020, registered a much more significant drop (-12.5%), mainly influenced by mineral water and, in conjunction, by the evolution of the Ho.Re.Ca. sector.
The remaining 10% is divided between condiments, sauces and tomato derivatives, which as a whole fell by around 0.6%.
At global level, the 2020 production of glass bottles is around 5,100 tons/000, 80% of which is represented by disposable bottles. If we subdivide by segment, it can be seen that 41.8% of the aforesaid bottles (disposable + returnable), were destined for the wine and sparkling wine market. On the other hand, 23.6% were bottles used in the mineral water area, while 14.2% were bottles used for beer. The remaining 20.4% is divided between other beverages (both alcoholic and non-alcoholic) for 10.5%, and condiments and tomato derivatives (purees) for 9.9%.
Jars
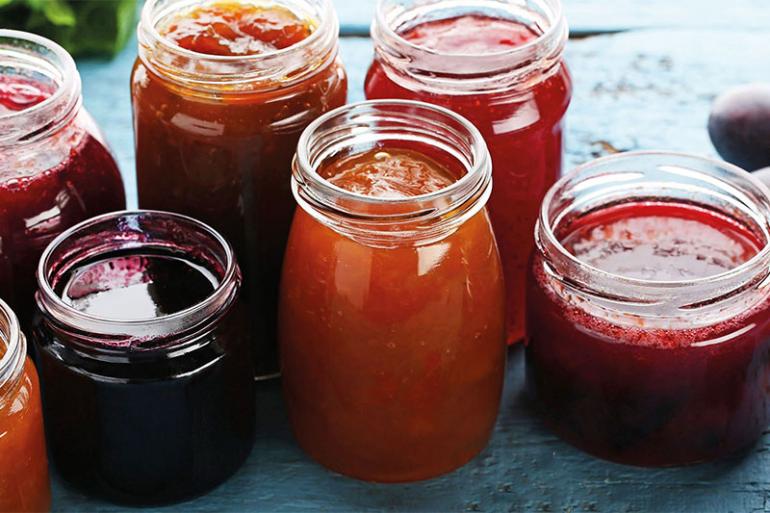
The production of glass jars (empty packaging still to be filled) represents 7% of the total production of glass packaging and, in 2020, is bucking the trend, since it has in fact recorded a positive trend (+11.1%). In contrast to the declines analyzed in the catering sector, domestic consumption instead gave a positive boost to the category.
As far as use is concerned, in 2020, an increase equal to +0.5% (about 491 t/000) was recorded. The trend of the sectors using glass jars has positively influenced the production of packaging, first and foremost the food preserve sector (including fish products and ready-made sauces), which accounts for 68.5%.
Among this type of product, pickles and produce in oil are the most representative (26.7%), followed by legumes (17.3%), homogenized food (9%), various types of ready-made sauces, both tomato-based and not (14.4%).
For seafood products, tuna, anchovies and sardines, 5.5% of glass jars were used in 2020, while the remaining 27.1% was divided between fruit in syrup, olives, corn, spices, jams, spreadable creams, yogurt and others.
Flacons
The production of hollow glass flacons (empty packaging) also bucked the trend, growing by 10.8%. Foreign trade decreased in terms of both exports and imports, with exports down 6.7% and imports down 2.5%.
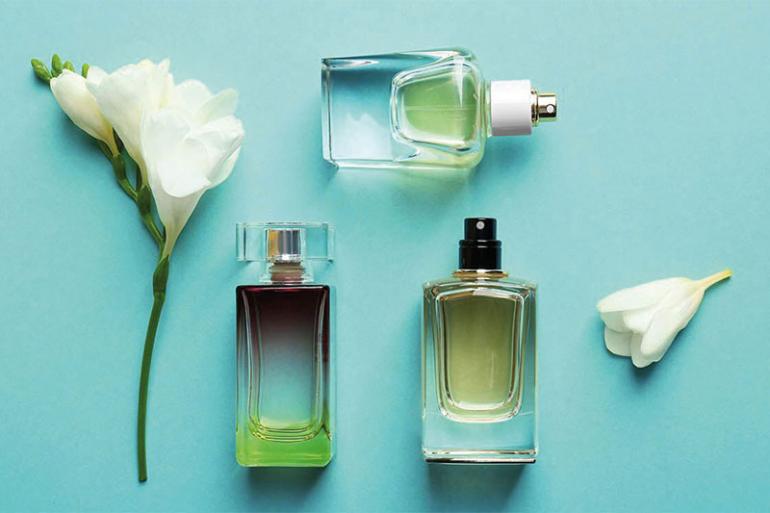
As regards the use of flacons, in 2020 59.5% were destined to the cosmetics field and 32.6% to the pharmaceutical sector; the remaining 7.9% comes under the listing "other sectors of use" mainly in the chemical field (paints, glues, etc.). This type of glass packaging represents 4% of the entire sector.
Tube glass vials and flacons
As for tube glass (1% of glass packaging), 85% is used in the pharmaceutical sector and the remaining 15% is divided between cosmetics and other uses.
The area registers a -11.2% in production, with a trend led exclusively by exports (-14.9%).
Recycling
According to data from Coreve, the consortium that within CONAI is responsible for managing the recovery of glass packaging, the results for 2020 are excellent. The percentage of recycled packaging is 78.6%, up 3.6% compared to 2019.
Also based on Coreve's data, it is assumed that the percentage of recycling in 2021 will continue to grow (+4.2% approximately), in the face of an increase in consumption and the hint of recovery in the Ho.Re.Ca. area.
A long history at a glance
Glass is among the first materials used to produce packaging.
It was the Egyptians, around 1.500 B.C., who produced the first hollow glass containers with extremely complex manufacturing processes, so much so that bottles destined to contain and preserve ointments and oils were reserved for the pharaohs.
However, it is necessary to go back to the second half of the first century BC to find traces of the technique of blowing and, with this, the production of bottles. An art in which Romans were masters, using the containers for the mixing and preservation of wine, as witnessed by the many archaeological findings.
The use of the glass bottle continued for centuries, but it was only in 1903 that the production process of glass packaging was industrialized, thanks to the invention of the automatic machine for blowing bottles. Technology and ingenuity soon led to other innovations: in 1925, in fact, a patent was registered for a new machine for the production of hollow glass using the blowing-blowing method. This method is still used today and allows the production of various types of hollow glass packaging.
