Italy in beverages
Data and facts on production, consumption and use of packaging in a market divided between alcoholic and non-alcoholic products. Analysis of the situation in 2016 and some tentative forecasts for the Italian market.
In Europe, consumption of alcoholic beverages (wine, beer and spirits) varies sharply from country to country, and there are naturally differences in market share according to the category of beverages.
In the European context, for example, Italy holds a preeminent position in mineral water (some 68%) and is also one of the world’s top three producers of wine and sparkling wines, along with France and Spain, with a share of about 18%. Italy is at 8% in the broad category of drinks (carbonated, flat, fruit juice and energy drinks).
But let’s take a closer look at the Bel Paese.
The market
In 2016, over 23,143 million liters of beverages were produced in Italy, of which 22.5% were alcoholic and 77.5% were non-alcoholic. After the conspicuous rises logged in 2015, the growth rates is thus at a weak +0.7%.
Alcoholic beverages
Following the production shrink during 2012-2013, alcoholic beverages as a whole have progressively recovered during 2014 and 2015.
The year 2016 closed with +2.9% production, this trend driven mainly by exports, which grew by 1.4%. Demand remained stable, and imports dropped by 11%.
Looking closer at specific alcoholic beverage types, performance varies greatly.
Output of wine and sparkling wines packaged in Italy grew by 1.7%, but sparkling wines considered alone grew by over 10%. High end wines are showing the strongest growth.
Beer production rose by about 5%, with craft beers predominating. This product has seen increasing popularity among Italian consumers.
Vermouth and alcoholic aperitifs have shown strong performance (+7.8%), driven primarily by domestic demand, thanks to the strong tradition of the aperitif “ritual”, both inside and outside the home.
Spirits also saw growth (+3.5%).
According to early estimates, 2017 should end with a growth trend in overall production of 1.4%, driven by increased domestic consumption.
In particular: wines and sparkling wines (+1%), beer (+2.7%), spirits (-1%), vermouth (+1.6%).
Non-alcoholic beverages
Non-alcoholic beverages have remained largely stable in 2016 (+0.1%), following excellent performance in 2015 (in line with the sector as a whole), which saw +8.9% growth.
Consumption dropped by 1.2% in the face of a sharply negative trend in imports (-30%). Exports grew by 3.3%.
The main sector in quantitative terms is mineral water, representing 75% of total production of non-alcoholic beverages, followed by soft drinks (14%).
Here are the 2016 trends of the various product types: mineral water: -0.3%; carbonated soft drinks: -2.9%; fruit juices: +12%; flat drinks: +5.4%.
The same trend as 2016 (+0.1%) continues in 2017, with a certain stabilization of consumption, which should rest around +0.1%. Imports will resume a growth trend (+5%), while exports should close the year at +1.4%.
Production of non-alcoholic beverages continues to be conditioned primarily by domestic demand, which absorbs approximately 90%.
Packaging mix 2016: the materials and their shares
Packaging has confirmed its role as a strategic variable in the beverage sector: in addition to protecting the product and enabling its distribution, it is also an important marketing tool.
Alcoholic beverages. This area sees the glass bottle holding the largest market share in all sectors even though, for wine and beer in particular, other types are in use.
Glass (disposable and recyclable) holds a 75% share, increasing since 2015 by one percentage point. This growth is largely due to two factors:
- the strong performance of high end wines, packaged exclusively in glass, to the detriment of lower cost wines. The latter are often offered in rigid polylaminate or plastic containers, but are showing a certain orientation toward glass, which significantly impacts the use of this material;
- the rise in consumption of craft beers, packaged exclusively in glass bottles, is helping glass to the detriment of cans. This trend continues in 2017.
The other major component of the beverage packaging mix are the rigid polylaminate containers used for wine (6%), which has dropped since 2015. Cans, used mostly for beer, follow with 3% in 2016.
PET bottles have a 1% share. The remaining 15% is made up of other packaging types, namely larger capacity containers (carboys, bag-in-box, kegs, etc.).
Non-alcoholic beverages. This area sees a prevalence of PET with 76.5%, followed by glass (17%), cans (2.5%), rigid polylaminates (2%) and other materials (2%). Other materials include, in particular, flexible packaging, but also PS cups and fountain drink dispensers.
Some forecasts
According to a preliminary analysis by Istituto Italiano Imballaggio for the year 2017, a trend somewhat favoring glass bottles emerges, especially for carbonated drinks. This is believed to be the result of marketing strategies, aimed at conveying a retro image, that have been especially appreciated by consumers. The trend is expected to continue into 2018.
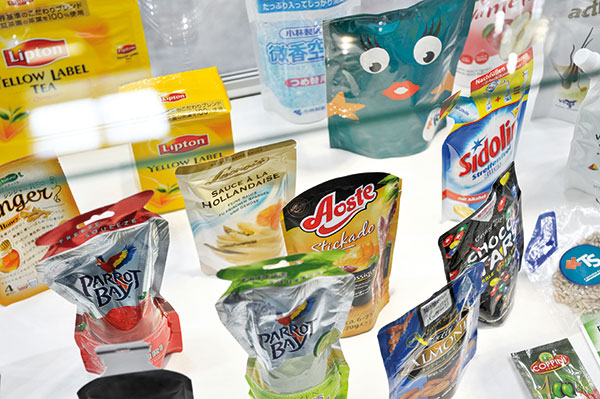
Flexible packaging for converting (cheerpacks) appears to be seeing growth, taking market shares off rigid polylaminate containers, especially in small formats.
The packaging mix of all beverages sees PET in first place (59.4%), followed by glass (29.8%). Cellulose polylaminate containers have a 3.2% share, cans 2.5% and the entry “other” (cheerpacks, disposable cups, fountain distribution, kegs, carboys) 5.1%.
Beverage packaging production continues to see interventions enacted in response to European directives on environmental impact. The weight/performance ratio has decreased.
Barbara Iascone
Istituto Italiano Imballaggio