Flexible packaging (2021)
Market facts and figures 2021: from the world to Italy, after a slight decline in 2020, the sector recovers.
Barbara Iascone
Istituto Italiano Imballaggio
The area of flexible converter packaging includes the types of packaging made by laminating, co-extruding and laminating multiple films of different materials (multi-material) or the same material (monomaterial). This is the youngest form of packaging on the market: of the highest technological value, it meets the increasingly sophisticated and complex requirements for the protection and distribution of a good.
The Market
It is well established that the market for flexible packaging is still growing, and that, partly by virtue of their “young” age they will continue to expand in the sectors where they are already used. There are many elements in their favor: the increasing use of convenience food, the continued attention to packaging design and graphics, and the constant demand for lightweight
World
In 2021, the world market for flexible converter packaging is estimated at about $102 billion, up 8% from the previous year.
The U.S. and Central and East Asia each share 28% of the market. At the European level, growth is around +6.4% for sales and +1.6% in terms of volume. Growth prospects for 2022, again at the European level, are 2.9% and 2%, respectively.
Italy
The data shared in this analysis refer to the production of flexible packaging obtained by coupling different materials: plastic, aluminum, cellulosic and, more recently, also biodegradable or compostable. It is essential to emphasize that the data for the Italian market refer, in quantitative terms, to tons of packaging, unlike what is expressed for the European market. After years of continuous and steady growth, in 2020 flexible packaging from converters registered a general decline of -1%. Undoubtedly the slump in convenience food consumption has exerted some influence in this regard.
In 2021, the production of flexible packaging from converters appears to be on the upswing across the board, ending the year with growth in both production and turnover: about 415,000 tons were produced in Italy (+4%) while turnover grew by 6.5%, exceeding 2.3 billion euros. Compared to global packaging production, flexible packaging accounted for 2.3% and 6.7% of total turnover. Exports covered 52% of production and dropped 1.6% in 2021; imports were minimal, hovering around 3,000 tons, and were constant over time.
Even in complicated periods, in which the packaging sector as a whole went as far as 12% declines, flexible packaging always managed to hold up and stem losses, which were quickly recovered in subsequent periods. Despite the selloff shown in 2020, flexible packaging from converters turns out to be among the best performing in the industry: consider that, since 2000, it has shown an average annual growth rate of +4.4%.
| 2018 | 2019 | 2020 | 2021 | |
|---|---|---|---|---|
| Turnover millions of euros | 2,184 | 2,250 | 2,227 | 2,227 |
| Companies operating in Italy | - | - | - | 80 |
| Approx. workforce | - | 6,991 | 7,115 | 7,130 |
| Production t/000 | 391 | 403 | 399 | 415 |
| Exports t/000 | 215 | 222 | 219 | 216 |
| Imports t/000 | 3 | 3 | 3 | 3 |
| Apparent usage | 179 | 184 | 183 | 202 |
Types and sectors of use
As is well known, flexible packaging is characterized, among other things, by the fact that it is made by coupling different materials-plastic, paper and aluminum-depending on the end use. They are subdivided according to the prevalence of this and that material: 73% plastic-dominated, 25% paper-dominated, and the remaining 2% aluminum-dominated.
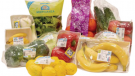
Food
Very high-tech, innovative and modern packaging, always adapting to new needs and new challenges, is widely used in the food sector, where it touches shares of about 95%. In this area, cheeses and fruit and vegetable IV are the largest users (26.4% the former and 25.7% the latter). Another sector with high utilization is bakery products and pasta food, which together absorb 19.6% of production. Other food types follow at a distance: with 4.6% share we have cold cuts, followed with 4% by frozen foods. Coffee accounts for 3.3% and pet food for 2%. The item “other food types” - sauces, yoghurt, pickles and pickles, baby food, candies and chocolates... - accounts for 9.4% Non-food. In this area, flexible packaging is used almost exclusively by the cosmetic/pharmaceutical and household cleaning sectors, which share 5% of the market. In cosmetics, single-dose formats are particularly developed, while in household detergents, refills for bottles are widespread.
| 2007 | 2008 | 2009 | 2010 | 2011 | 2012 | 2013 | 2014 | 2015 | 2016 | 2017 | 2018 | 2019 | 2020 | 2021 | |
|---|---|---|---|---|---|---|---|---|---|---|---|---|---|---|---|
| FC | 100 | 99 | 95.7 | 101.3 | 108 | 108 | 112.3 | 116.7 | 121.7 | 124.3 | 127.3 | 130.3 | 134.3 | 133 | 138 |
| TOT. PACK. | 100 | 96.9 | 85.9 | 90.5 | 90 | 85.5 | 85.2 | 88.6 | 90.7 | 93.6 | 96.7 | 98.5 | 100.6 | 99.1 | 106 |
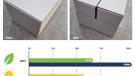
Raw materials for production
As recorded in previous years, the greater use of paper compared to the use of plastic and aluminum is confirmed in 2021. Continued growth in the use of biodegradable/compostable materials, either through the coupling of paper + plastic (biodegradable/compostable) or plastic + plastic in both cases biodegradable/compostable. This is a development in line with increased demands for environmentally friendly packaging. This type of coupling is used, for example, in the manufacture of pouches for packaging food dough and cookies. Based on data from the Italian Packaging Institute’s database, it is assumed that out of about 53,000 tons of flexible converter packaging used, 8% was made through the coupling of biodegradable/compostable materials.
| 2020 | 2021 | |
|---|---|---|
| Bakery products and pasta | 20.00% | 19.60% |
| Cheese | 27.00% | 26.40% |
| Processed meats, (cold-cut, cured meats) | 4.40% | 4.60% |
| Frozen foods | 4.10% | 4.00% |
| Convenience produce | 24.80% | 25.70% |
| Coffee | 3.30% | 3.30% |
| Petfood | 1.90% | 2.00% |
| Other foodstuffs | 9.10% | 9.10% |
| Total food | 94.60% | 94.70% |
| Pharmaceutical | 2.70% | 2.60% |
| Domestic detergents | 2.70% | 2.70% |
| Other non foods | 5.40% | 5.30% |
| Total | 100% | 100% |