Glass packaging (2021)
Types, quantities and uses of hollow glass and tube glass packaging. Market data and facts of 2021: elegance and sustainability are supporting their widespread use in a variety of sectors, underscoring the quality of packaged products.
Barbara Iascone
Istituto Italiano Imballaggio
This analysis looks at both hollow and tube glass packaging.
For hollow glass packaging, the subdivision used in Packaging in Figures and shared with the trade association Assovetro, is divided into bottles, jars and bottleware. Tube glass packaging is used in the pharmaceutical sector and can be essentially of two types, vials and bottles.
ACCORDING TO DATA FROM COREVE, the consortium within CONAI that manages the recovery of glass packaging, a recycling rate of 76.6% will be recorded in 2021, with the amount recycled growing by 1.8% compared to 2020. Consumer input grew by 4.6% and national collection by 0.9%.
How the market is changing
The scope of use of glass packaging is wide: from the food and beverage sector to the cosmetic and pharmaceutical sectors.
A characteristic feature of this type of packaging is its strong rootedness in the areas where it is used (particularly wine, sparkling wine, and super spirits). Precisely because of this peculiarity, their evolution is closely linked to the performance of the user sectors rather than to shifts in the packaging mix of the sector itself, although lately there has been some small movement precisely in favor of glass packaging.
After being subjected to stiff competition from competing packaging for some years and achieving relative stability, glass packaging has in some cases been “rediscovered” by some brands, which have adopted it as a symbol of rebirth.
In practice, the oldest packaging on the market has accompanied innovation and sustainability campaigns, where its elegance and recyclability are emphasized. A recent example is the packaging of high-quality milk in glass bottles, which have returned to supermarket refrigerated counters after several years of absence and are particularly popular with consumers. Another recent achievement is the area of flat drinks: more and more often, at bars or restaurants, we find iced tea packaged in glass bottles, for example.
| Year | Production | Exports | Imports | Apparent consumption |
|---|---|---|---|---|
| 2001 | 3,519 | 459 | 306 | 3,366 |
| 2002 | 3,540 | 433 | 356 | 3,463 |
| 2003 | 3,561 | 458 | 305 | 3,408 |
| 2004 | 3,602 | 476 | 378 | 3,504 |
| 2005 | 3,561 | 411 | 362 | 3,512 |
| 2006 | 3,568 | 419 | 367 | 3,516 |
| 2007 | 3,641 | 453 | 381 | 3,569 |
| 2008 | 3,695 | 450 | 433 | 3,678 |
| 2009 | 3,354 | 360 | 398 | 3,392 |
| 2010 | 3,528 | 405 | 544 | 3,667 |
| 2011 | 3,590 | 421 | 552 | 3,721 |
| 2012 | 3,414 | 412 | 571 | 3,573 |
| 2013 | 3,463 | 442 | 522 | 3,543 |
| 2014 | 3,719 | 440 | 614 | 3,893 |
| 2015 | 3,811 | 467 | 656 | 4,000 |
| 2016 | 3,937 | 445 | 704 | 4,196 |
| 2017 | 4,048 | 452 | 679 | 4,275 |
| 2018 | 4,167 | 482 | 793 | 4,478 |
| 2019 | 4,369 | 513 | 834 | 4,690 |
| 2020 | 4,326 | 465 | 910 | 4,771 |
| 2021 | 4.578 | 527 | 1.075 | 5,125 |
Evolution
Assumptions regarding the evolutionary trend of glass packaging, while increasingly difficult to work out due to the precarious state of the world economy, we are optimistic. The use of this type will grow in the coming years, both because of the constant development of e-commerce in our country as well, which will lead to a demand for glass-packaged beverages, and because of a continuous change in the consumption behaviors and habits of Italians, who express more and more attention to eco-friendly and elegant packaging. We are therefore led to assume an average annual growth rate for the next 5 years of around 1.5%.
Industry data 2021
According to the analysis published in Imballaggio in Cifre (Istituto Italiano Imballaggio, ed. 2022, Assovetro data processing), in 2021 the production of glass packaging (empty) expressed in tons recovered the losses recorded the previous year. Thus, 2021 closed with a trend growth of +5.8 percent, bringing it to over 4,500 t/000 total.
Foreign trade also recorded an overall recovery: +18.1% for imports, +13.5% for exports.
However, the usual negative trade balance for Italy is confirmed, resulting in higher apparent consumption of glass packaging than domestic production. This characteristic is related to both bottles and jars, as our production capacity cannot meet the needs of the domestic market, thus forcing us to draw on imports.
To be recorded is the +10% growth in turnover in the sector.
| Bottles (including returnables) | 2021 | 2020 |
|---|---|---|
| Alcoholic beverages | 72.10% | 71.90% |
| Non alcoholic beverages (1) | 12.30% | 12.60% |
| Condiments (2) | 6.70% | 6.40% |
| Other (3) | 8.90% | 9.10% |
| Total | 100% | 100% |
(1) Milk included
(2) Food oil and vinegar
(3) Tomato sauces and ketchup
| Jars | 2021 | 2020 |
|---|---|---|
| Vegetable preserves and sauces | 53.20% | 52.90% |
| Babyfoods | 10.80% | 11.10% |
| Fish preserves | 4.20% | 4.30% |
| Sauces | 6.50% | 6.30% |
| Other food | 12.00% | 12.30% |
| Other non food | 13.30% | 13.10% |
| Total | 100% | 100% |
| Hollow glass flacons | 2021 | 2020 |
|---|---|---|
| Cosmetics and perfumes | 59.80% | 59.50% |
| Pharmaceutical products | 32.50% | 32.60% |
| Other (1) | 7.70% | 7.90% |
| Total | 100% | 100% |
(1) Chemicals
| Flacons and vials in tubular glass | 2021 | 2020 |
|---|---|---|
| Cosmetics and perfumery | 85% | 85% |
| Pharmaceutical | 14% | 14% |
| Other (1) | 1% | 1% |
| Total | 100% | 100% |
(1) Chemicals
Hollow glass packaging
Bottles
Bottle production always accounts for 88% of the hollow glass packaging sector and in 2021 records a nice recovery, ending the year with a nice +6%, undoubtedly comforted by the +9% in exports.
Bottle imports record a leap forward, growing by more than 20% over 2020; all these positive trend rates go on to positively affect apparent consumption (which does not take into account stock movement), leading it to grow by 8.2%.
The positive evolutionary trends of the various sectors of use have, as always, affected the packaging in question: 72.1% of the bottles used are for alcoholic beverages, which is on the upswing in 2021 in terms of overall production (+4%). The non-alcoholic beverages area, including milk, accounts for about 12.3% of the sector and, after a decidedly negative 2020, is somewhat stable in 2021.
The edible oil area accounts for 6.7% of bottles, with a clear predominance of olive oil, which recovers a few percentage points in 2021.
As for the use of glass bottles for 2021, it is estimated to be over 4,200 t/000.
Jars
The production of glass jars (empty packaging yet to be filled) accounts for 6.5% of total glass packaging production. After a sharply growing 2020, it suffers a setback in 2021 and closes the year with a 5% decline (the downsizing is physiological, after the 11% recorded in the pandemic year). Compared to 2019, however, production is up 6%.
As for utilization, in 2021, the trend is stable at +0.2% with the use of about 664 t/000.
The segmentation of the glass jar area is developed among different types of products. The most representative area is vegetable preserves + ready-made sauces (53.2% of the segment).
The baby food area (homogenized products) accounts for 10.8% of the segment, while the “other food” item is at 12% share (fruit in syrup, olives, corn, spices, jams, spreadable creams, yogurt and others fall under this item). Sauces account for 6.5 percent of the use of glass jars, and the canned fish sector (tuna, anchovy fillets, mackerel fillets, etc.) accounts for 4.2%. Finally, the item “other non-food,” related to the cosmetics and pharmaceutical sectors, accounts for 13.3% of the sector.
Vials and flacons
The production of bottleware from hollow glass, again empty packaging, also shows a trend with a trend rate of +20%. Same trend for foreign trade, where imports close at +21.5% while exports at +21%.
In terms of their use, in 2021 there is 59.8% destined for the cosmetics sector and 32.5% for pharmaceuticals; the remaining 7.7% refers to the item “other areas of use,” mainly in the chemical sector (paints, glues, etc.). This type of glass packaging accounts for 4.9% of the entire sector.
Tube glass packaging
As for tube glass, or the remaining 0.5% of glass packaging as a whole, 85% is used in the pharmaceutical sector and the remaining 15% is divided between cosmetics and other uses.
The area records a production growth of +8.6%.
Image header credits: Bormioli Luigi
Glass: A history at a glance
Glass is among the first materials used to produce packaging.
It was the Egyptians, around 1.500 B.C., who produced the first hollow glass containers with extremely complex manufacturing processes, so much so that bottles destined to contain and preserve ointments and oils were reserved for the pharaohs.
However, it is necessary to go back to the second half of the first century BC to find traces of the technique of blowing and, with this, the production of bottles. An art in which Romans were masters, using the containers for the mixing and preservation of wine, as witnessed by the many archaeological findings.
The use of the glass bottle continued for centuries, but it was only in 1903 that the production process of glass packaging was industrialized, thanks to the invention of the automatic machine for blowing bottles. Technology and ingenuity soon led to other innovations: in 1925, in fact, a patent was registered for a new machine for the production of hollow glass using the blowing-blowing method. This method is still used today and allows the production of various types of hollow glass packaging.
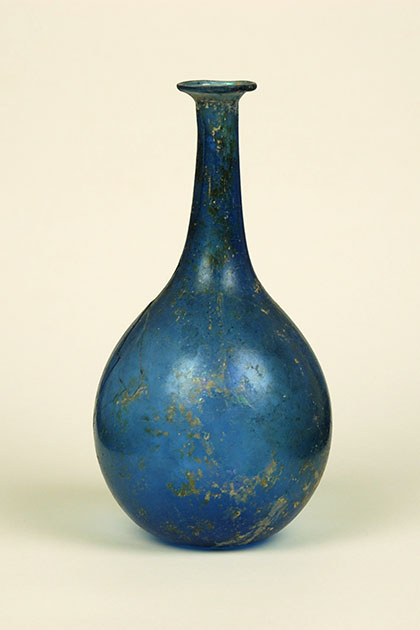
1. About the Allaire Collection of glass, b17r blue bottle
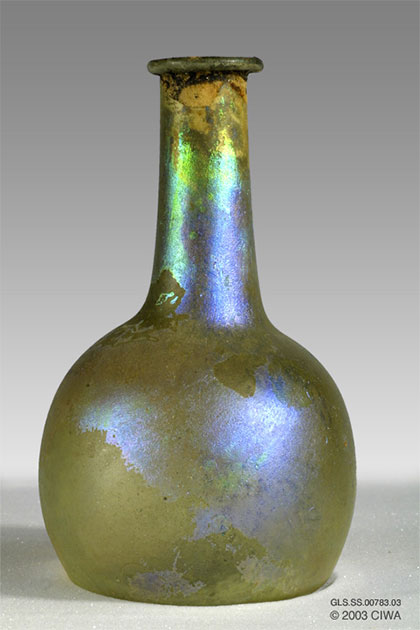
2. Iridescent glass flask, Palestine, 40 BC-30 AD, virtual Egyptian Museum
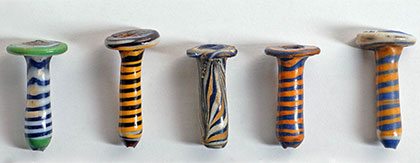
3. Colourful beads for collars and wigs or earrings? Glass adornment from Egypt, British Museum