Packaging of alcoholic and non-alcoholic beverages
Facts, figures and dynamics of the sector in 2020 in Italy with the consumption trend of packaging; first, cautious anticipations on the evolution of the market in 2021 and a focus on soft drinks. In this completely anomalous year, the analysis of the beverage sector shows very different trends.
 The subject of this analysis is the alcoholic and non-alcoholic beverages department, produced in Italy, imported and exported, as well as consumed in our country (for this last parameter we take into consideration all the beverages distributed through the different sales channels, large-scale distribution, HoReCa, online sales, etc.).
Turnover and production volumes
Overall, the sector saw a drop of around 4% in terms of turnover, a result that, in a year such as 2020, can be defined as satisfactory. The alcoholic beverages area, which is closer to the HoReCa world, suffered the most.
The most significant declines were concentrated in the first 8 months of the year, with a recovery at the end of the year: the first four months recorded a drop compared to the same period of 2019 of -4%, in the second four months production contracted by -6%, again compared to the same period of the previous year.
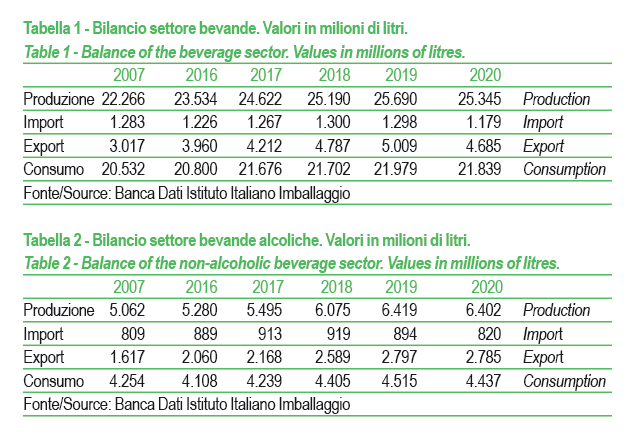
The situation changes significantly when considering volumes, as the decline is reduced to -1.3% (25,345 million liters of beverages produced in 2020).
The difference between the two trends lies in the fact that the biggest drop was in higher value beverages, generally destined for hotellerie, restaurants, bars... a sector that, as is well known, has undergone significant decreases of over 30%. Nearly 75% of production thus refers to non-alcoholic beverages, the remaining 25% to alcoholic beverages.
Both imports and exports are down (the latter down 9.2% and the latter down 6.5%, respectively), while apparent consumption is substantially stable, even if account is not taken of stock movements, a phenomenon that is very present in this sector, especially in the alcoholic sector.
As far as evolutionary hypotheses are concerned, in 2021 we should see a certain stability in production which will begin to grow at a more sustained rate from 2022. Much will depend on consumption from the summer period onwards, with the decrease in contagion and the advancement of the vaccination process. Consumption outside the home, including ceremonies and public events, should also contribute to increasingly supporting production.
Alcoholic beverages
From 2007 to 2020 alcoholic beverages featured the following average annual evolution trends: production +2%; export +5.6%; import +0.1%; consumption +0.3%.
Wines, sparkling wines, beer, spirits and aperitifs are classified in the alcoholic beverages market area which, in 2020, registered a -0.3% in production (about 6,400 mln liters).
Supporting the trend, thus limiting losses, is the beer sector, whose production grew by almost 4%. On the other hand, wine production decreased, while sparkling wines, aperitifs and spirits were stable.
Also in this context, wines and sparkling wines as a whole are the most representative beverages (63.6% of the segment).
In terms of foreign trade, imports fell by over 8% and exports by just 0.4%. Apparent consumption fell by 1.7%.
As far as 2021 is concerned, a recovery is hypothesized, considering the desirability of a return to a more active social life; the spirits segment should therefore register growth of around +1.5%/2%.
 Non-alcoholic beverages
From 2007 to 2020 non-alcoholic beverages featured the following average annual trends: production +0.8%; export +2.7%; import -1.9%; consumption +0.5%.
In 2020 there is also a downward trend for soft drinks.
Production decreased by 1.7% compared to the previous year, with volumes of around 18,940 million liters. The trade balance sees exports at -14.1% and imports at -11.2%. Apparent consumption is fairly stable (down 0.3%).
Based on the analysis of volumes, the most representative beverage of the segment turns out to be mineral water (76% of production) and precisely because of this decisive representativeness, it is the segment that most influences the sector trend: in 2020, settling at around 14,850 mln liters, the production of mineral water stands at -0.3%.
After the positive trend recorded in 2019, soft drinks also record a production decrease in 2020, with a production that marks a -0.5% exceeding 2,500 mln liters.
The negative trend for fruit juices and nectars, already highlighted in 2019, is confirmed, with a production that closes 2020 at -8%. Substantially stable is the production of flat drinks (0.6%).
Also for the soft drinks sector, a certain recovery in production is assumed in 2021, with a growth rate around 1%.
 Packaging
The anomalous trend of the market in 2020 has also had a significant influence on the packaging mix of the entire sector; the movements to the detriment or in favor of one material over another have been determined essentially by the types of beverages that are most consumed, but also by the prolonged standstill of everything related to the HoReCa sector.
For this reason, glass, for example, is among the materials that have suffered the most.
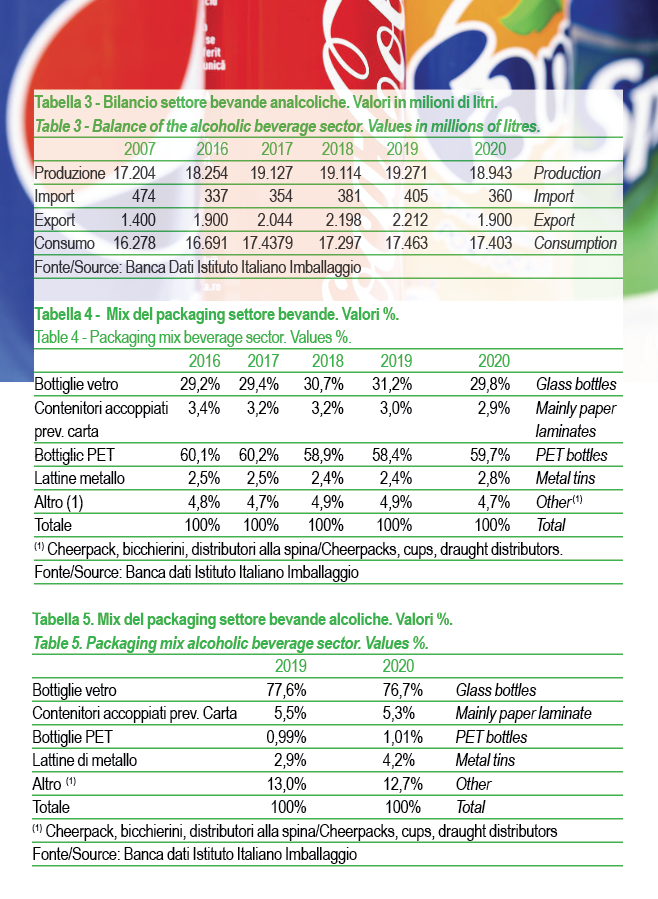
For the beverages sector as a whole (alcoholic + non-alcoholic drinks), the 2020 packaging mix (final data) sees the pre-eminence of plastic bottles, with a share of 59.7%, followed by glass with a share of 29.2%. Rigid containers made of poly-coated cellulose have a share of 2.9%, cans 2.8% and the other item (cheerpack, plastic cups, draught distribution, kegs, demijohns) 4.7%.
Alcoholic drinks. However, the glass bottle continues to be the most used packaging for alcoholic beverages, with a market share of 76.7% although decreasing compared to 2019; followed by the item "other" (kegs, demijohns and draught dispensers) with 12.7%, with a percentage decreasing compared to 2019. Briks represent 5.3% of the packaging mix while metal cans account for 4.2%.
Plastic bottles represent only 1%. Of note is the recovery of positions of both cans and plastic, which can be traced back to the reasons brought for the decline in glass, which, for the latter two materials, had an opposite effect.
Non-alcoholic drinks. Within the non-alcoholic beverages segment, the plastic bottle remains predominant, of which mineral water is the main user: in 2020 the market share was 80%, up compared to 2019. Even here, glass is decreasing (13.7%), followed by cartons (2%), cans (2.4%) and "other" (cheerpack, kegs and dispensers on tap) at 2%.
Hypothetical future trends. Future trends will follow the dynamics of past years. The recovery of out-of-home consumption will bring the packaging mix back to the percentages recorded in 2019. Attention to the environment will remain constant, favoring those types of packaging that will use raw materials coming from recycling, for example the rPET bottles used to package mineral water. Also the increasing diffusion of smaller formats will be an important feature of the near future, as well as the continuous diffusion of the use of reusable flasks for the consumption of still drinks, especially mineral water.
Barbara Iascone
Istituto italiano Imballaggio
FOCUS ON SOFT DRINK
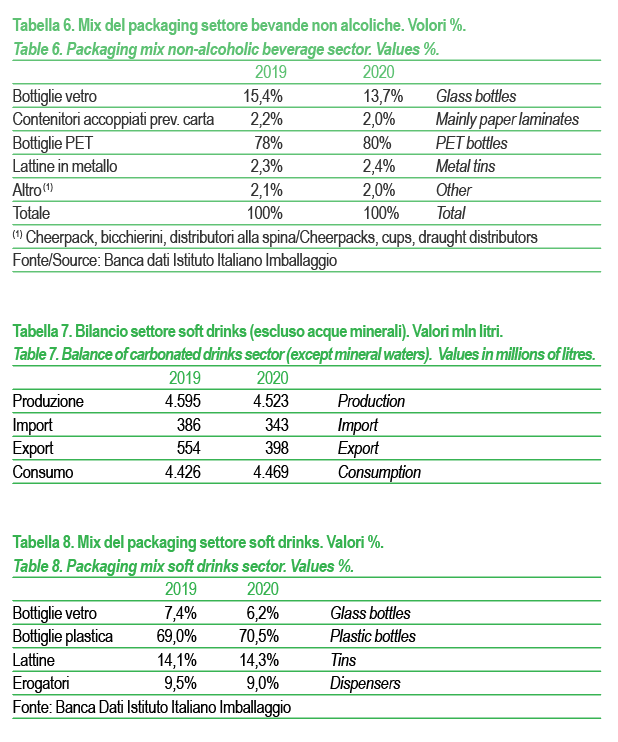
If we exclude mineral water, within the non-alcoholic beverage segment soft drinks (carbonated-soda drinks) are the most representative product in terms of volume, with a 13% representation.
After the positive result recorded in 2019 in terms of consumption of carbonated drinks, in Italy in 2020 we again witnessed a downsizing of demand and production.
Among carbonated beverages, cola is the most consumed, about 50%, and it is also the beverage where the most investment has been made both in terms of marketing and advertising, and in terms of research to offer a wider choice of different types (sugar-free, caffeine-free, with stevia,etc.).
Orangeades represent 17% of carbonated beverages and year after year they continue to lose their position in the sector.
26% is represented by other carbonated beverages (chinotto, various flavored drinks, foams, etc.), the remaining portion is divided between tonics and non-alcoholic aperitifs.
Packaging. The packaging mix sees the clear prevalence of plastic (70.5%), which will continue to grow in 2020, thanks to the sharp drop in consumption outside the home and the simultaneous affirmation of domestic consumption, focused on this type of packaging. Cans follow with 14.3%. Draught beverage dispensers account for 9% of total packaging. Glass, which recorded positive growth rates until 2019 in this area, in 2020 comes to represent 6.2%, losing a few percentage points compared to 2019.
Starting in 2021, but the phenomenon will be more evident from 2022, the dynamics of the packaging mix will again be influenced by trade policies and market trends. Glass will resume its positive trend.