Plastic packaging – Data 2019
Production trend and market positioning of rigid packaging, non laminated flexibles and accessories. Balance sheet data 2019.
Barbara Iascone
Istituto Italiano Imballaggio
As a whole, the “plastic packaging” area covers - in terms of weight - 20% of the entire packaging sector, of which 2% concerns flexible converter packaging (the majority of which involves the presence of a plastic film). Reasoning in terms of turnover, the situation changes since the percentage of representativeness with respect to the entire packaging sector reaches 53%, of which 7% is attributable to flexible packaging.
Types of plastic packaging
Plastic packaging is divided into three macro areas:
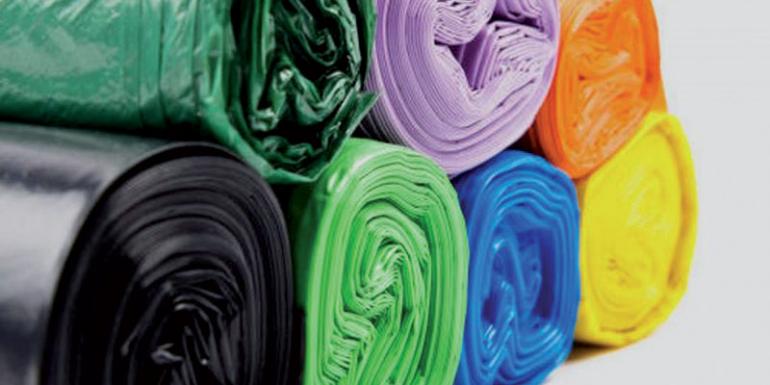
- flexible packaging (films and bags, excluding converter flexibles);
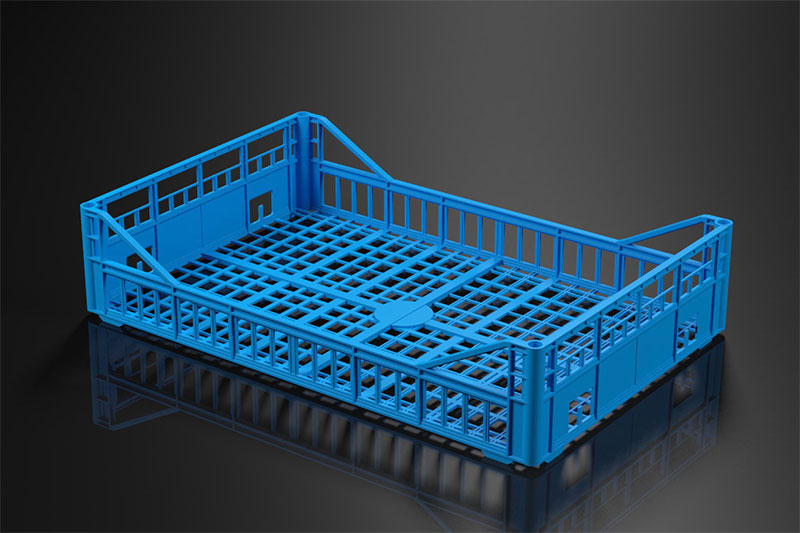
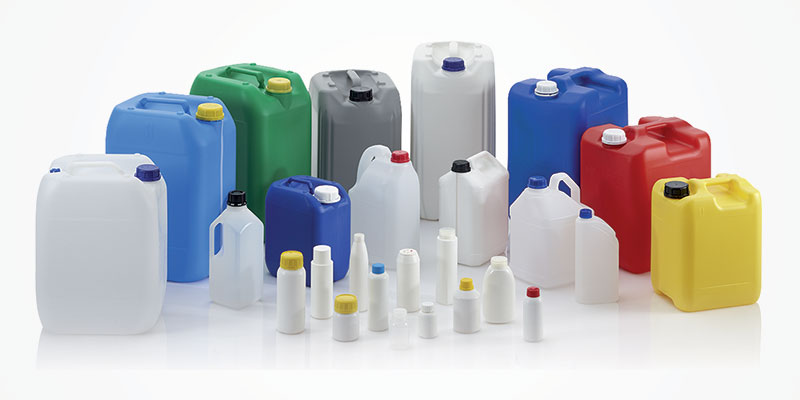
- rigid packaging (bottles, drums, crates, pallets);
- accessories (strapping, caps, chips, plates, adhesives, etc.).
44.5% is represented by rigid packaging, 46.8% by flexible packaging, excluding converter flexible; the remaining part concerns accessories (closures, protective packaging, ties, straps, etc.).
Here we examine both rigid packaging and flexible packaging and unlamented flexible packaging, intended for the production of shoppers, films, protective bubble wrap, etc. (thus excluding flexible converter packaging). In addition to the two categories mentioned above, we also analyze accessories, i.e. closures, ties, straps, etc..
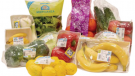
Specifically, rigid packaging is mainly “blown” containers (beverage bottles, detergent bottles, etc.), but the category also includes thermoformed containers, such as trays used for the packaging of food products (ice cream, fruit and vegetables, meat, fish, etc.).
As far as flexible packaging is concerned, here we examine both films for food use and shrink-wrapped films for palletizing.
These types of packaging are very common in our daily life and although they are very much disputed, they must still be considered as an important resource, especially in the fight against food waste.
Notes on recycling. According to the data processed by COREPLA (a supply chain consortium of the CONAI system, which manages the recovery and recycling of plastic packaging) in 2019 1,378,384 t were recycled in the consortium, with a growth trend of 13% compared to 2018.
Market consideration
Nel 2019 il settore degli imballaggi di plastica registra un tasso di crescita della produzione pari al 2,6% (3.080 t/000). Continua ad aumentare il ricorso alle plastiche da riciclo a scapito di quelle vergini, così come anche l’impiego di bioplastiche (utilizzate principalmente per produrre sacchetti) mantiene un trend positivo.
In 2019 the plastic packaging sector recorded a production growth rate of 2.6% (3,080 t/000). The use of recycling plastics continues to increase at the expense of virgin plastics, as well as the use of bioplastics (mainly used to produce bags) maintains a positive trend. Both rigid and flexible packaging unquestionably drive the development of the sector: both categories grow by about 3% compared to 2018, while accessories show a negative trend, which affects the overall growth percentage.
Foreign trade is decreasing, with negative trends in both exports and imports, respectively -2.7% and -2.2%.
As for the entire packaging sector, the flow of trade mainly concerns European countries (especially France and Germany): 89.6% of exports have outlets in Europe, and 82.2% of imported empty plastic packaging always comes from this area.
The turnover of the sector registers a growth rate of around +2%.
| 2016 | 2017 | 2018 | 2019 | 19/18 var % | |
|---|---|---|---|---|---|
| Production | 2,889 | 2,974 | 3,003 | 3,080 | 2.60% |
| Export | 1,019 | 1,057 | 1,046 | 1,018 | -2.70% |
| Import | 567 | 594 | 579 | 566 | -2.20% |
| Apparent consumption | 2,437 | 2,511 | 2,536 | 2,628 | 3.60% |
Source: Istituto Italiano imballaggio
In Italy, according to the first available estimates, in 2019 the production of bioplastic materials should have recorded a growth rate of more than 5%, settling at around 93,500 t against 88,500 t in 2018.
In first place for the use of bioplastics, we find bags for the transport of goods (62% of the total), followed by ultralight bags used for the packaging of fruit and vegetables in bulk (17.5%); the remaining 20.5% is divided between bags for the collection of biowaste(15%), articles for agriculture (3%), catering (disposable dishes), food packaging (trays) and personal hygiene (2.5% in total).
| Food | 51.20% |
| Beverages | 23.40% |
| Chemical petroleum (1) | 6.40% |
| Cosmetics and pharmaceuticals | 3.80% |
| Various systems (2) | 15.30% |
| Total | 100% |
Source: Istituto Italiano imballaggio
(1) Lubricants, paints, varnishes and various chemicals.
(2) Machinery handling (electromechanics, textile machinery, electronics, etc.)
Sectors of use
Easily adaptable to any need, plastic packaging is widely used both in the food and non-food sectors, and thanks to the nature and different characteristics of the various polymers can be used to pack both liquids and solids.
However, the main outlet sector remains food: in 2019 74.5% of plastic packaging was used to pack food and beverages, divided between 51.2% for the former (down from 2018) and 23.4% for the latter, which is growing.
On the other hand, 6.4% of total production went to the chemical sector and 3.8% to the pharmaceutical sector.
The remaining 15.3% finds its outlet in various manufacturing areas (clothing and accessories, building materials, etc.). This segment also includes shoppers, which alone account for 4.5.
In the beverage sector, mineral water bottles alone account for 16% of total plastic packaging.
| Flexible packaging (films, bags and sacks) | 46.50% |
| Rigid packaging (bottles, drums, crates, pallets) | 44.80% |
| Packaging accessories (caps, various closures, bubble films, strapping, foamed chips, slabs, adhesive tapes, etc.) | 8.7% |
| Total | 100.00% |
Source: data processing Imballaggio in Cifre
Plastic quotation
In 2019 the average prices of virgin raw materials used to produce plastic packaging were down compared to 2018 (the reference prices are those of the Milan Chamber of Commerce).
Analyzing all the polymers involved in the production process, the most significant drop is undoubtedly PET, which, compared to 2018, shows a 14.7% drop in quotations.
The same is true for plastics coming from recycling, which instead register increases in prices: the blue rPET in flakes increases by 22.3% and the multicolor by 10.2%.
Similarly, if for PE the prices of virgin raw material show decreases ranging between -9.5% for the low density and -4% for the high density one, granules deriving from recycling grow on average by 3.8%.
As far as PP is concerned, the prices of both virgin and recycled polymers have dropped by about 3.5-4%.
| 2019 | ||
|---|---|---|
| Country | Export | Import |
| Europe | 89.60% | 82.20% |
| Africa | 3.70% | 5.50% |
| America | 3.40% | 0.70% |
| Asia | 2.90% | 11.60% |
| Oceania | 0.40% | 0.01% |
| World | 100.00% | 100.00% |
Source: data processing ISTAT