Pharmaceuticals and Nutraceuticals (2024)
2024 packaging numbers: an analysis of one of the leading industries in terms of production and innovation
Barbara Iascone – Italian Packaging Institute
In 2024, the Italian pharmaceutical industry continued its growth, recording a 7.6% increase over the previous year. As a key driver of the national economy, the industry ranked first in terms of contribution to GDP growth between 2022 and 2024, recording a 17.7% increase compared to a modest 1.4% increase in overall GDP.
Packaging numbers: volumes and consumption
According to the classification introduced by the Ministry of Health, pharmaceutical products fall into three main categories: approximately 83% of packages are prescription (ethical) drugs in classes A, B and C; approximately 3% are other ethical products available without a prescription; and 14% are over-the-counter drugs, which continue to grow. The following analysis of Italy's pharmaceutical packaging mix focuses exclusively on ethical and OTC drugs sold in pharmacies with a prescription, thus it does not include hospital and veterinary drugs. Based on data processed through the Italian Packaging Institute's database, an estimated 2,205 million packs were produced in 2024, a 6.7% increase over the previous year. From 2010 to 2024, the average annual growth rate stood at 0.6%, equivalent to approximately 56,300 tonnes of packaging. These figures refer to primary packaging only, and do not include cardboard boxes, information leaflets or any accessories used to dispense the medication. When secondary packaging, accessories, closures and transport packaging are included, the total weight rises to approximately 125,700 tonnes (an increase of 7.3% compared to 2023).
Packaging mix by material
In the pharmaceutical industry, changes to the packaging mix are inherently limited due to the nature of the product under analysis. Any changes in this regard must undergo extensive testing and validation protocols to protect the safety and preservation of the product, making it challenging to adopt new packaging types. As a result, the packaging mix tends to remain relatively stable, with any variations largely dictated by market trends. According to the Italian Packaging Institute's Database for the year 2024, the breakdown of primary packaging materials is as follows:
- Aluminium accounts for 61%. Blister packs alone accounted for 56.4% of all pharmaceutical packaging, while flexible and rigid tubes accounted for 3.6% and spray cans for 1%.
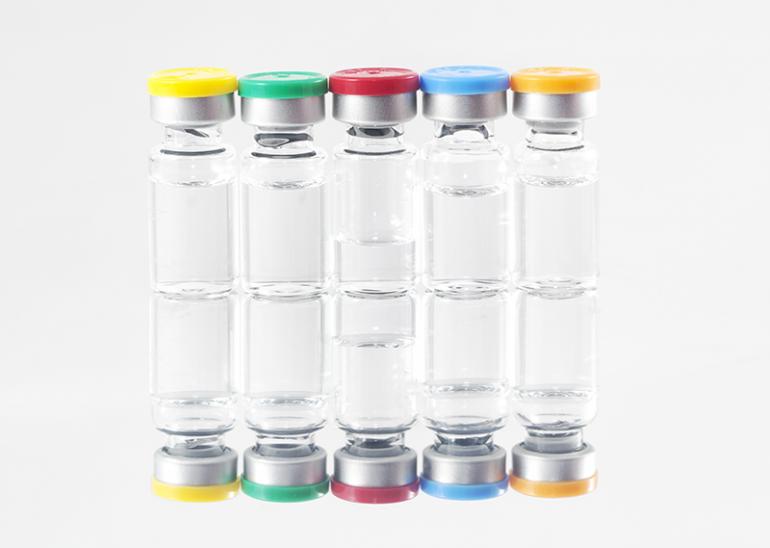
- The second most widely used material remains glass, which represents 20.3% and includes various types of packaging: small bottles for drinkable products (44.1%), vials for injectable products (31.1%), bottles for syrups (24.4%). Glass vials for ophthalmic use account for just 0.4%, having largely been replaced by plastic in this segment.
- Plastic packaging makes up 18.5%, including various bottles and flexible tubes, flexible laminated pouches and sachets, strips, etc.
- Containers made of spiral-wound cardboard used for granular pharmaceutical products account for 0.2% of the market.
Liquid products
This category includes liquid medicines for oral use, injectable drugs and non-oral preparations (primarily ophthalmic products). In recent years, plastic bottles have gained one percentage point in market share. As of 2024, glass accounts for 61.7%, plastic for 35.4%, and laminated sachets for the remaining 2.9%, reflecting a slight shift in favour of glass over plastic. Injectable liquids are packaged exclusively in glass. In contrast, the third category of liquid medicines is packaged as follows: 93% in plastic vials, 5% in laminated sachets, and 2% in glass vials.
Solid products
Starting with oral medications (e.g. granules, tablets, coated pills), the packaging mix in recent years has shown some variation and can be broken down as follows: 91.8% in blister packs (ALL/PVC or ALL/ALL), 4.4% in polybags, 2.1% in plastic bottles, 0.8% in rigid aluminium tubes, 0.5% in glass vials, and 0.4% in spiral-wound cardboard containers.
Other types of products
The packaging mix for creams, ointments, gels or foams has not changed and can be broken down as follows: 66% in aluminium tubes, 24% in plastic tubes and 10% in laminated sachets.
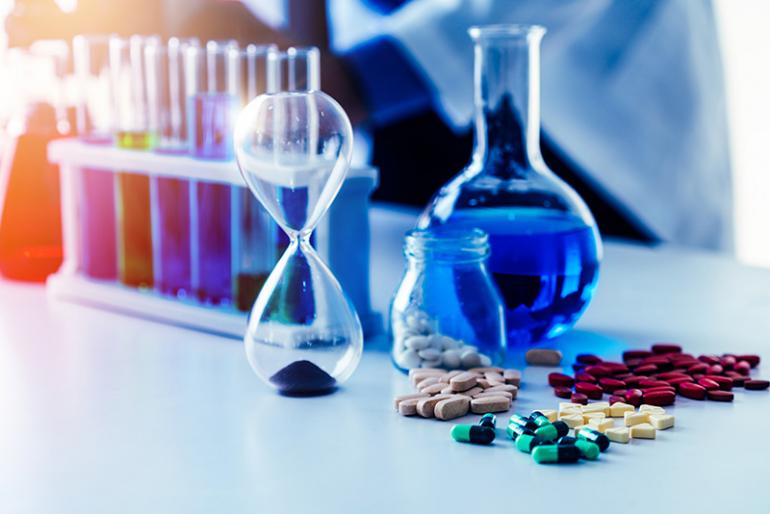
Focus on nutraceuticals
Alongside the pharmaceutical industry, the nutraceutical segment is gaining increasing attention in Italy. This category includes food supplements that, while not classified as medicines, are nevertheless used to treat various health conditions and ailments. This category includes probiotics, vitamins and other essential nutrients that are not obtained directly from food but are instead consumed through dietary supplements containing the nutrients in a concentrated manner. Nutraceuticals include probiotics, antioxidants, polyunsaturated fatty acids (omega-3 and omega-6), vitamins and enzyme complexes. These products are primarily used to prevent chronic diseases, improve health, slow the ageing process and increaselife expectancy. In 2024, 77% of nutraceutical products in Italy were sold through pharmacies, followed by para-pharmacies (8.1%), the large-scale retail channel (7.7%), which continues to grow, and the online channel (7.1%). (Source: Italian Food Union). The Italian nutraceutical market reached a turnover of €5.2 billion in 2024, marking a 5.5% increase over the previous year. Italy also confirmed its leadership in the European market, accounting for 26% of total EU sales. Best-selling products include vitamins, minerals, probiotics, and supplements for mental wellbeing, as well as products for cholesterol control and gut health.
Packaging
According to data from the Italian Packaging Institute database, more than 330 million packages of nutraceutical products were produced in 2024, broken down as follows: 43.8% in plastic/aluminium blister packs (used for capsules and tablets); 36.8% in plastic jars and bottles; 13.7% in glass jars and bottles; 5.3% in laminated sachets; and 0.4% in aluminium tubes. The total volume of packaging used in this sector, including secondary, transport and accessory packaging, amounted to 14,140 tonnes.