Medicines and nutraceutical products: market and packaging
Analysis of a top Italian industrial sector for production and innovation capacity. Packaging numbers for 2022: quantities and consumption of ethical and OTC medicines, with a look at nutraceutical products.
Barbara Iascone
Italy is the top country in Europe for the production of medicines: in terms of turnover, in 2022, the pharma industry grew by 10%, with a surge in exports, rising by 44% against 2021. The positive production trend will certainly have positive effects also on employment: around 67 thousand people currently work in the pharmaceutical sector, 90% of whom are graduates or high-school leavers, and of which 43% are female.
Sector trend
On the basis of Prometeia’s analysis, the pharmaceutical sector as a whole – over-the-counter products, including hospital products and veterinary medicines – showed a positive trend in 2022 with regards to production, recording +2.7% against 2021.
According to Federfarma’s analysis, subsidised pharmaceutical spending, with the exclusion of medicines for veterinary use, has also recorded a growth (+2%). There is also an increase in the number of national health service prescriptions (+3.2%), but with a fall in the average value of each single prescription of -1%, and a fall in the number of packages per prescription.
Packaging numbers: quantities and consumption
The general subdivision of the different types of medicine is into three categories: around 84% of packages relate to ethical products in classes A, B and C (with reference to the breakdown by the Ministry of Health); around 2.5% relates to other ethical products sold without medical prescription; 13.5% to over-the-counter medicines, showing an upward trend.
Our analysis regarding the mix of packaging in the Italian pharmaceutical market takes into consideration only the area of ethical and OTC medicines sold in pharmacies, with a medical prescription, excluding, therefore, medicines for hospital use and medicines for veterinary use. Analysing the data of the Italia Packaging Institute’s Data Base, it emerges that in 2022 the packages of medicines produced in Italy numbered around 1,889, up by 2.7% compared to 2021, with reference to only primary packaging; cardboard boxes, descriptive leaflets and any accessories used to dispense the medicine are, therefore, excluded.
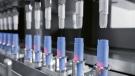
Primary packages alone used for packaging pharmaceutical products in 2022 reached 48,400 tonnes. In a wider analysis that includes all the types of packages involved - including, therefore, both secondary packaging and transport packaging, and accessories - arrive at a total of 106,000 tonnes. Again analysing 2022 data, 64.5% of ethical and OTC medicines sold in pharmacies were in solid form (including granules and tablets), 30% in liquid form and 5.5% in other forms, (creams, gels, foams, transdermic, etc.).
| 2010 | 2011 | 2012 | 2013 | 2014 | 2015 | 2016 | 2017 | 2018 | 2019 | 2020 | 2021 | 2022 | 22/21 | var % m.a. | |
|---|---|---|---|---|---|---|---|---|---|---|---|---|---|---|---|
| 2030 | 2050 | 2061 | 2071 | 2081 | 2052 | 2003 | 1965 | 1951 | 1933 | 1916 | 1839 | 1889 | 2.70% | -0.60% |
The packaging mix subdivided by materials
With regards to primary packaging, the findings of the Italian Packaging Institute with reference to 2022 are set out below.
- 61% relates to aluminium. Blisters alone represent 56.4% of the entire category, while flexible tubes account for 3.6% and spray cans 1%.
- The second most used material remains glass, with 20.3%. Bottles for drinkable products represent 43.9% of glass packaging, followed by vials for injectable products with 31% and bottles for syrups at 24.7%. Glass vials for ophthalmic products stand at around 0.4%, largely replaced by plastic, now dominant in this category.
- Plastic packaging stands at 18.5%, composed of vials and flexible tubes, alveoli and envelopes in flexible laminate, strips, etc.
- Spiral cardboard containers for granular pharmaceutical products represent 0.2% of the market.
| 2016 | 2017 | 2018 | 2019 | 2020 | 2021 | 2022 | |
|---|---|---|---|---|---|---|---|
| Aluminium packaging | 60.7 | 60.7 | 60.5 | 60 | 60.7 | 61 | 61 |
| Blister products | 55.8 | 55.9 | 55.8 | 55.4 | 56.5 | 56.4 | 56.4 |
| Flexible and rigid tubes | 3.9 | 3.8 | 3.7 | 3.6 | 3.3 | 3.6 | 3.6 |
| Metal spray cans | 1 | 1 | 1 | 1 | 0.9 | 1 | 1 |
| Glass packaging (vials, flacons, bottles) |
20.2 | 20.2 | 20.5 | 21 | 20.7 | 20.3 | 20.3 |
| Plastic packaging | 18.9 | 18.9 | 18.8 | 18.8 | 18.4 | 18.5 | 18.5 |
| Flacons, flexible tubes, etc. | 12 | 12 | 12 | 12.1 | 11.9 | 11.9 | 11.9 |
| Bubble packs, strips, polylaminate bags, monodose |
6.9 | 6.9 | 6.8 | 6.7 | 6.5 | 6.6 | 6.6 |
| Spiral-wound carton | 0.2 | 0.2 | 0.2 | 0.2 | 0.2 | 0.2 | 0.2 |
| Total | 100 | 100 | 100 | 100 | 100 | 100 | 100 |
Product type
Analysing the pharmaceutical product areas segmented by type, we find liquid products, solid products and cream/gel/foam products. Each of these areas is characterised by a different packaging mix: for liquid and cream products, for example, there has been a slight shift of the segment in favour of plastic with respect to glass. In general, however, the pharmaceutical sector has not seen great changes in the type of materials used, considering the rigid controls to which it is subject. The packaging mix therefore tends to remain unchanged, even though very small shifts have occurred in the last few years.
Liquid products. These are liquid medicines to be drunk, medicines to be injected and non-drinkable medicines (mainly ophthalmic). In the last two years, plastic bottles have gained half a percent of the share of this category: drinkable liquid medicines are packaged for 61.5% in glass packaging, 35.5% in plastic bottles, and the remaining 3% is represented by laminated sachets. Injectable liquid medicines are packaged exclusively in glass, while the third category of liquid medicines is packaged for 93% in plastic vials, 5% in laminated sachets and the remaining 2% in glass vials.
Solid products. Moving on to medicines in solid form, starting from those to be taken orally (granules, tablets, dragees, etc.), the packaging mix is as follows: 92% in ALL/PVC or ALL/ALL blisters; the rest is divided between poly-laminate sachets (4.5%), plastic bottles (2%), rigid aluminium tubes (1%) and glass vials (0.5%).
Creams, ointments, gels or foams. These types of pharmaceutical products are packaged for 65% in aluminium tubes, 24.5% in plastic tubes and 10.5% in laminated sachets.
The mix of secondary and transport packaging and closures.
As already mentioned, in the pharma sector, secondary packaging also plays an important role. There is a significant use of cardboard boxes, which contain not only primary packaging, but also the information slip, as well as possible accessories necessary for dispensing the medicine itself. In this case, it is estimated that in 2022 such packages amounted to around 36,700 tonnes. It goes without saying that, as for the industrial sector, also the pharma industry makes use of transport packaging (corrugated cardboard boxes, pallets, stretch film etc.). With regards to closures, they are subdivided into aluminium ones (58%) and plastic ones (42%).
| Products liquid oral use | |
|---|---|
| Glass bottles | 61.5 |
| Plastic bottles | 35.5 |
| Laminated pouches | 3 |
| Injectable liquid products | |
| Plastic bottles | 93 |
| Laminated pouches | 5 |
| Glass vials | 2 |
| Solid oral products | |
| Blisters in ALL/PVC ALL/ALL | 92 |
| Laminated pouches | 4.5 |
| Plastic bottles | 2 |
| Aluminium tubes | 1 |
| Glass vials | 0.5 |
| Cream/gel/foam products | |
| Aluminium tubes | 65 |
| Plastic tubes | 24.5 |
| Laminated pouches | 11 |