Surface science and GD-OES analysis
Next generation instruments and methodologies make it possible to better understand packaging materials and the possible interactions of their contents. Laminazione Sottile explains the promise of GD-OES, a method for quantitative spectroscopic analysis of metals and other solid materials, applied to chemical analysis of surfaces.

Francesco Bravaccino, Anthony Ipock, Ciro Sinagra
Laminazione Sottile Spa - R&D Dpt
The study of materials and surface phenomena is arousing active interest in the scientific community.
For instance, the hydrophilic/hydrophobic behavior of surfaces with regard to a polar liquid like water, or nonpolar ones like many organic liquids.
These effects depend on the microgeometry of the material surface, but the primary factor is the chemical profile of the surface chemistry.
Adhesion of a polymer coating to a support surface is the classic example of interaction between different materials, governed by the physical and chemical phenomena of the interface.
Understanding the chemistry of surfaces is thus essential to deeper understand the fascinating subject of surface science.
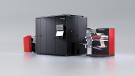
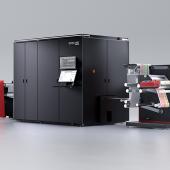
 Figura 1: GD-OES Profiler 2 by Horiba Scientific. Figure 2.1 e 2.2: Photo and description of functioning GD-OES Profiler 2. |
What follows is a description of the potential of Glow-Discharge Optical Emission Spectroscopy (GD-OES), a spectroscopic method for quantitative analysis of metals and other solids.
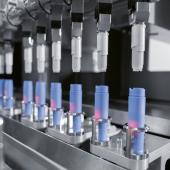
Using plasma to erode the sample surface in a controlled manner, it is possible to analyze 40 chemical elements by performing nanometric scans from the surface to the bottom of the sample.
This technique makes it possible to see differences in concentration level of chemical elements detected between the surface and the internal layers of the sample (e.g. oxygen on the surface, alloying elements which tend to migrate to the surface or characteristic elements found in the chemical conversion layers of the surface).
The technique also enables analysis, by looking at variations to the surface chemistry, of various materials laminated together (plated or coated metals and/or those laminated with polymer or inorganic film).
GD-OES analysis offers enormous potential for the study of materials used for packaging, which play an essential role in protecting, preserving and sometimes cooking foods, so that industry can understand surface phenomena and investigate possible interactions between container and contents (figures 1, 2.1 e 2.2).
TWO PRACTICAL EXAMPLES
In order to verify the effectiveness of GD-OES analysis (described in the following page) two examples are provided below.
1. Analysis of coatings on rolled aluminium foil used to produce coated tubs loaded with filler for increased shelf life.
A filler containing zinc and other elements was added to an internal coating for aluminium tubes varnished with thermoseal polyester lacquer.
Using the GD-OES technique, the surface was examined to determine the distribution and thickness of the coating, which contains trace amounts of zinc, being a characteristic element of the filler used.
Figure 3 is a diagram showing the presence of zinc (bright blue) with a high concentration on the surface, peaking at 5 nm. The concentration rapidly declines before stabilizing at a thickness of approximately 20 nm, forming a plateau of 110 nm.
Using alternative techniques (e.g. SEM and EDS micro-analysis with x-rays), this profile would not have been revealed, since x-rays penetrate the sample at a depth of 2-3 µm (far exceeding the nanometric thickness we were able to achieve using the GD-OES technique).
 Figure 3: GD-OES profilometric diagram of elements detected in a sample of aluminium varnished with polyester lacquer with a zinc-based filler. Zn profile in bright blue, H in green, C in black and Al in orange. The latter is detected approximately 80 nm beneath the coating. Figure 3: GD-OES profilometric diagram of elements detected in a sample of aluminium varnished with polyester lacquer with a zinc-based filler. Zn profile in bright blue, H in green, C in black and Al in orange. The latter is detected approximately 80 nm beneath the coating.Figure 4: Example of thickness/intensity diagrams superimposed with a CrII-based conversion coating on an aluminium sheet for wine capsules, analyzed using the GD-OES technique (RF-GD-OES Profiler 2 by Horiba), with incremental surface pretreatment weight (blue: Cr1- low weight; brown: Cr4 - high weight). |
2. Analysis of a phospho-chromatation (Cr+3) surface treatment on an AA8011 aluminium alloy laminate for the production of capsules for alcoholic beverages
Production of high drawing wine capsules (capsule Ø 30mm h=60mm) requires excellent adhesion of varnishes applied with sheet-coating technology on a 0.23 mm AA8011 aluminium alloy laminate. Once the sheet-coating process is complete, the laminate is subjected to a three-step drawing process to obtain the capsule format described above. If the coating is insufficiently adhesive, the mechanical stress of the drawing process may cause it to separate from the laminate.
The inducted coupled plasma (ICP) technique was used to analyze samples treated in increasingly long-exposure phosopho-chromatation bath in order to develop standards for quantitative analysis of the chrome.
The procedure involves chloric acid extraction of the superficial metallic layer and quantitative analysis of the mg/m2 of the chrome. The same samples were subjected to GD-OES analysis to obtain a profile of the various samples and describe a curve (weight vs thickness), useful for performing quick checks on samples of unknown concentration (figures 4 and 5).
 Figure 5: Calibration line obtained from the correlation of the thickness values measured with the GD-OES technique and basic conversion layer weights Cr+ 3 detected with ICP technique (for dissolution). The two measurements are shown to be directly proportional, with a very high coefficient of determination (> 0.98). |
IN CONCLUSIONE
L’analisi GD-OES, associata ad altre tecniche di analisi fisiche (esempio energia di superficie mediante angolo di contatto con liquido polare e apolare) può fornire una serie di informazioni utilissime per analizzare e comprendere i fenomeni che avvengono all’interfaccia tra materiali di diversa natura chimica.
La semplicità dell’esecuzione dei test GD-OES, che non richiede preparazioni particolari del campione (es: solubilizzazione del rivestimento mediante attacchi chimici, puliture o metallizzazioni delle superfici dei componenti organici, ecc…), fa sì che le analisi possano essere condotte in tempi molto ridotti, con poco dispendio di personale ma ottenendo risultati analitici su scale nanometriche.
Tale tecnica si rivela fondamentale nelle analisi di rivestimenti nanotecnologici sia di natura organica che inorganica.
|
I principi della tecnica GD-OES Il fenomeno del bagliore al plasma è conosciuto sin dagli inizi del ‘900 con l’invenzione delle lampade a fluorescenza, che sfruttano il principio dell’emissione di luce di gas, generalmente nobili e inerti, quando sono attraversati da corrente elettrica ad alto voltaggio. Solo negli anni ‘80 il fenomeno è stato accompagnato a tecniche spettrofotometriche per analisi quantitativa di alta precisione, sino ad allora raggiunte con la spettrometria di massa atomica a fiamma e a ioni secondari (SIMS). Lo sviluppo di luce è causato dall’enorme differenza di potenziale generata ai capi della camera in cui è contenuto il gas dove, dal lato del catodo (positivo), vi è un accumulo di cariche elettriche negative, che formano una “guaina”. Tale accumulo di cariche porta il sistema a uno stato energetico altissimo ed è qui che ha luogo il bagliore e lo stato di plasma è tenuto stabile da una nube di elettroni secondari. Tali elettroni vengono utilizzati per bombardare la superficie del campione che rilasciano ioni degli elementi costituenti, che finiscono nel plasma. L’enorme quantità di atomi presenti in camera favoriscono una serie di urti a catena, portando le specie ioniche rilasciate a uno stato elettronico superiore, chiamato di “eccitazione elettronica”. Data l’instabilità di tale stato energetico, gli elettroni energizzati ritornano al loro stato naturale, rilasciando l’energia accumulata sotto forma di spettri di radiazioni elettromagnetiche (luce), caratteristica dell’elemento. Il plasma può essere utilizzato per erodere in profondità il campione strato per strato, portando all’eccitazione gli atomi in struttura. Tali elementi rilasciano a loro volta delle radiazioni elettromagnetiche caratteristiche degli elementi presenti (spettro di emissione) che è possibile collimare ad una griglia di diffrazione per indirizzare tale spettro a dei rilevatori ottici che ne misurano l’intensità e quindi la quantità. In aggiunta, i sistemi più recenti presentano un sistema interferometrico (chiamato DiP - Depth interferometric Profiler) con cui viene misurata al secondo la geometria del cratere sviluppato dalla tecnica man mano che progredisce in profondità. Quello che si ottiene è un diagramma delle intensità (o delle concentrazioni con opportuna calibrazione) in relazione con la profondità del campione, ovvero un profilo spettrale dimensionale. |
|
BIBLIOGRAFIA: -Thomas Nelis, Richard Payling - “Glow Discharge Optical Emission Spectroscopy: A pratical Guide-RSC Analytical Spectroscopy Monographs Series editor: N W Barnett, Deakin University, Australia - Royal Society of Chemistry, Cambridge, UK 2003. -Horiba Scientific - Fundamentals on RF-GD-OES GD training Part 1. -Ciro Sinagra - “Dalle nanotecnologie di pretrattamento alla verniciatura di nastri metallici” Convegno ANVER Nanotecnologie - Politecnico di Milano Aula Natta, 17 novembre 2016. -Ciro Sinagra, Francesco Bravaccino, Carla Velotti - “Foil in alluminio: focus sulle superfici” - ItaliaImballaggio n. 10/2016, Edizioni Dativo, pag. 16-20. |